
- Start >
- Rivers >
- Discharge >
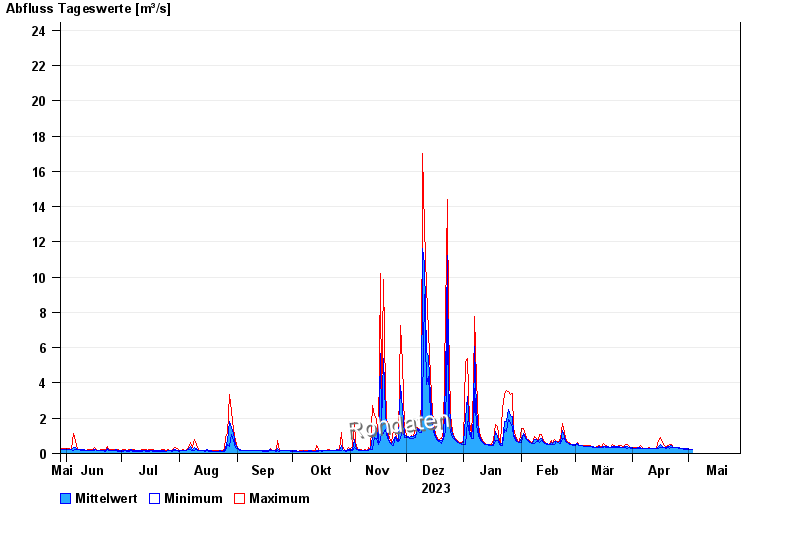
- Untere Donau >
- Kollbach >
- Chart of year

Chart of year Kollbach / Kollbach
Discharge from 29.05.2023 to 28.05.2024
- 10.06.1965 Abfluss: 49 m³/s
- 22.06.1965 Abfluss: 48,1 m³/s
- 01.06.1965 Abfluss: 45,9 m³/s
- 02.06.1995 Abfluss: 45,5 m³/s
- 15.02.1990 Abfluss: 44,4 m³/s
| Date | Mean value [m³/s] | Maximum [m³/s] | Minimum [m³/s] |
|---|---|---|---|
| 17.05.2024 | 0.346 | 0.538 | 0.226 |
| 16.05.2024 | 0.229 | 0.251 | 0.226 |
| 15.05.2024 | 0.241 | 0.304 | 0.226 |
| 14.05.2024 | 0.245 | 0.251 | 0.226 |
| 13.05.2024 | 0.245 | 0.251 | 0.226 |
| 12.05.2024 | 0.251 | 0.251 | 0.251 |
| 11.05.2024 | 0.26 | 0.277 | 0.251 |
© Bayerisches Landesamt für Umwelt 2024