
- Start >
- Rivers >
- Discharge >
- Untere Donau >
- Kollbach >
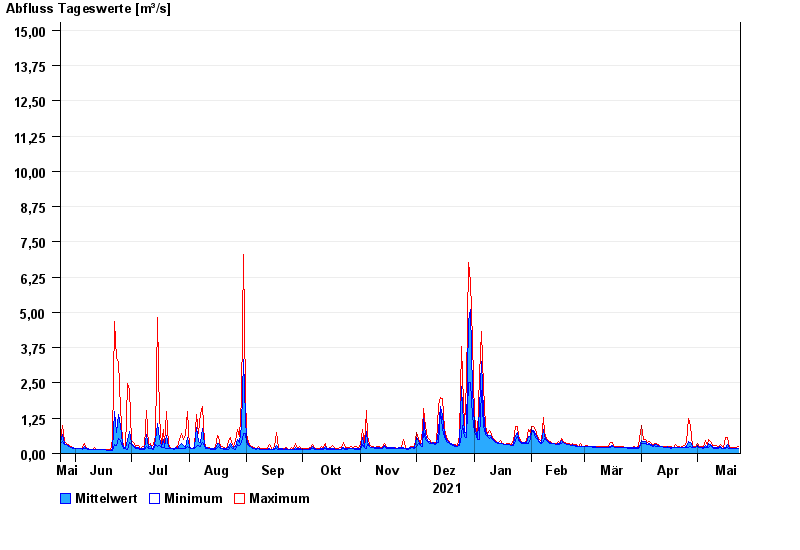
- Chart of year

Chart of year Kollbach / Kollbach
Discharge from 24.05.2021 to 23.05.2022
- HQ1 25 m³/s
- HQ2 32 m³/s
- HQ5 35 m³/s
- HQ10 45 m³/s
- HQ20 57 m³/s
- HQ50 72 m³/s
- HQ100 90 m³/s
| Date | Mean value [m³/s] | Maximum [m³/s] | Minimum [m³/s] |
|---|---|---|---|
| 23.05.2022 | 0.183 | 0.246 | 0.164 |
| 22.05.2022 | 0.179 | 0.202 | 0.164 |
| 21.05.2022 | 0.184 | 0.201 | 0.164 |
| 20.05.2022 | 0.19 | 0.222 | 0.182 |
| 19.05.2022 | 0.191 | 0.222 | 0.181 |
| 18.05.2022 | 0.194 | 0.222 | 0.181 |
| 17.05.2022 | 0.31 | 0.555 | 0.201 |
© Bayerisches Landesamt für Umwelt 2024