
- Start >
- Rivers >
- Discharge >
- Untere Donau >
- Kollbach >
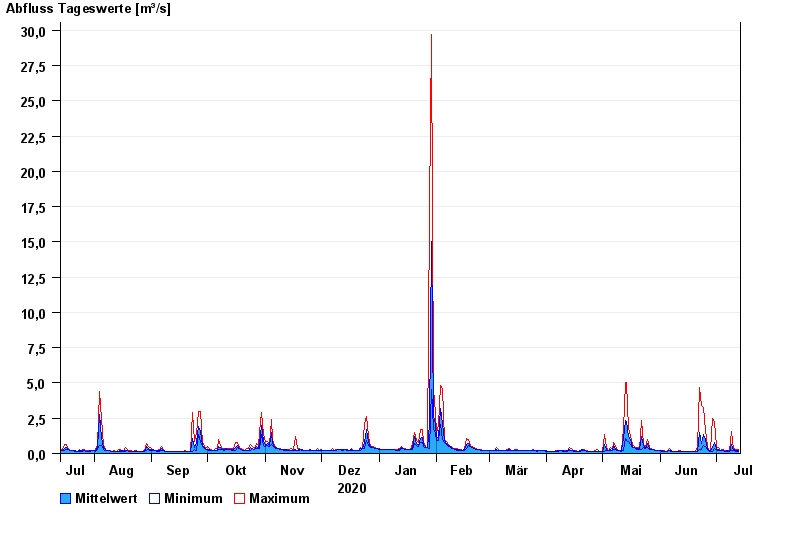
- Chart of year

Chart of year Kollbach / Kollbach
Discharge from 14.07.2020 to 13.07.2021
| Date | Mean value [m³/s] | Maximum [m³/s] | Minimum [m³/s] |
|---|---|---|---|
| 13.07.2021 | 0.181 | 0.311 | 0.157 |
| 12.07.2021 | 0.204 | 0.259 | 0.174 |
| 11.07.2021 | 0.279 | 0.37 | 0.193 |
| 10.07.2021 | 0.222 | 0.284 | 0.193 |
| 09.07.2021 | 0.668 | 1.54 | 0.235 |
| 08.07.2021 | 0.17 | 0.235 | 0.157 |
| 07.07.2021 | 0.19 | 0.235 | 0.157 |
© Bayerisches Landesamt für Umwelt 2024