
- Start >
- Rivers >
- Discharge >
- Untere Donau >
- Kollbach >
- Chart of year

Chart of year Kollbach / Kollbach
Discharge from 24.05.2023 to 23.05.2024
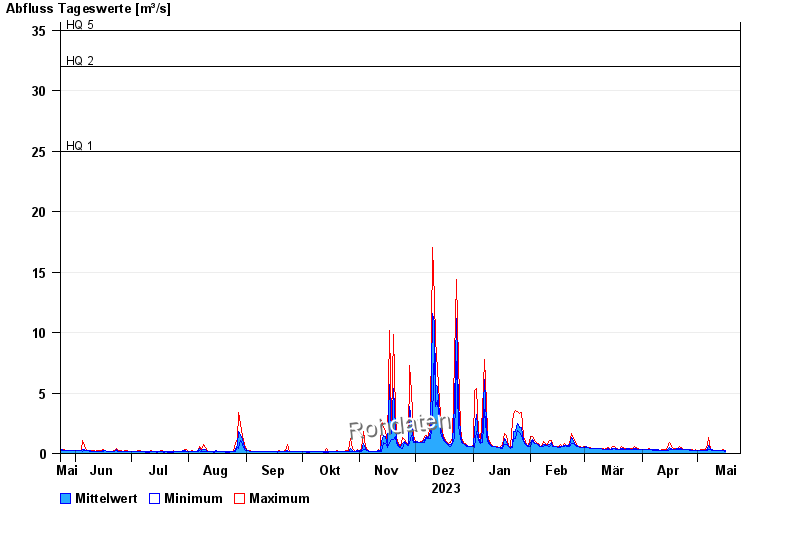
- HQ1 25 m³/s
- HQ2 32 m³/s
- HQ5 35 m³/s
- HQ10 45 m³/s
- HQ20 57 m³/s
- HQ50 72 m³/s
- HQ100 90 m³/s
| Date | Mean value [m³/s] | Maximum [m³/s] | Minimum [m³/s] |
|---|---|---|---|
| 23.05.2024 | 0.344 | 0.538 | 0.277 |
| 22.05.2024 | 0.68 | 1.1 | 0.304 |
| 21.05.2024 | 0.246 | 0.304 | 0.226 |
| 20.05.2024 | 0.254 | 0.277 | 0.251 |
| 19.05.2024 | 0.39 | 0.577 | 0.277 |
| 18.05.2024 | 0.262 | 0.364 | 0.251 |
| 17.05.2024 | 0.346 | 0.538 | 0.226 |
© Bayerisches Landesamt für Umwelt 2024