
- Start >
- Rivers >
- Discharge >
- Untere Donau >
- Kollbach >
- Chart of year

Chart of year Kollbach / Kollbach
Discharge from 20.10.2021 to 19.10.2022
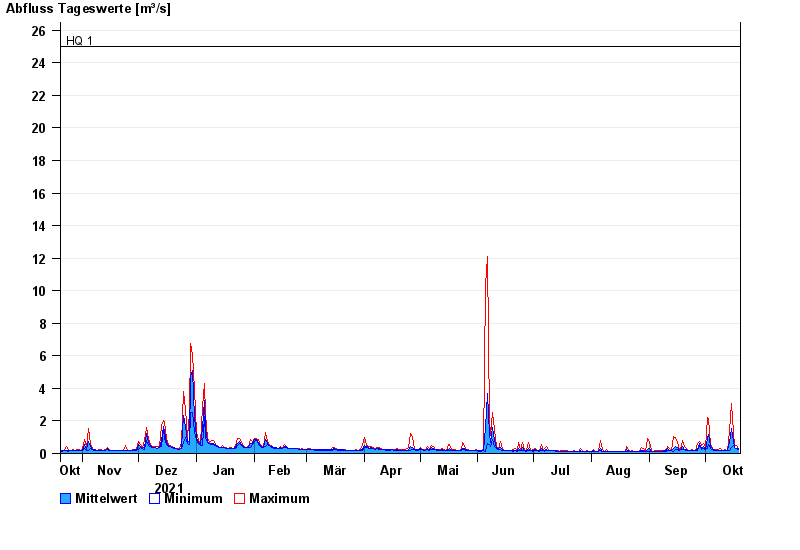
- HQ1 25 m³/s
- HQ2 32 m³/s
- HQ5 35 m³/s
- HQ10 45 m³/s
- HQ20 57 m³/s
- HQ50 72 m³/s
- HQ100 90 m³/s
| Date | Mean value [m³/s] | Maximum [m³/s] | Minimum [m³/s] |
|---|---|---|---|
| 19.10.2022 | 0.281 | 0.317 | 0.264 |
| 18.10.2022 | 0.332 | 0.514 | 0.289 |
| 17.10.2022 | 0.391 | 0.475 | 0.345 |
| 16.10.2022 | 0.749 | 1.3 | 0.475 |
| 15.10.2022 | 1.53 | 3.08 | 0.343 |
| 14.10.2022 | 0.651 | 1.35 | 0.193 |
| 13.10.2022 | 0.194 | 0.213 | 0.192 |
© Bayerisches Landesamt für Umwelt 2024