
- Start >
- Rivers >
- Discharge >
- Untere Donau >
- Köfering >
- Chart of year

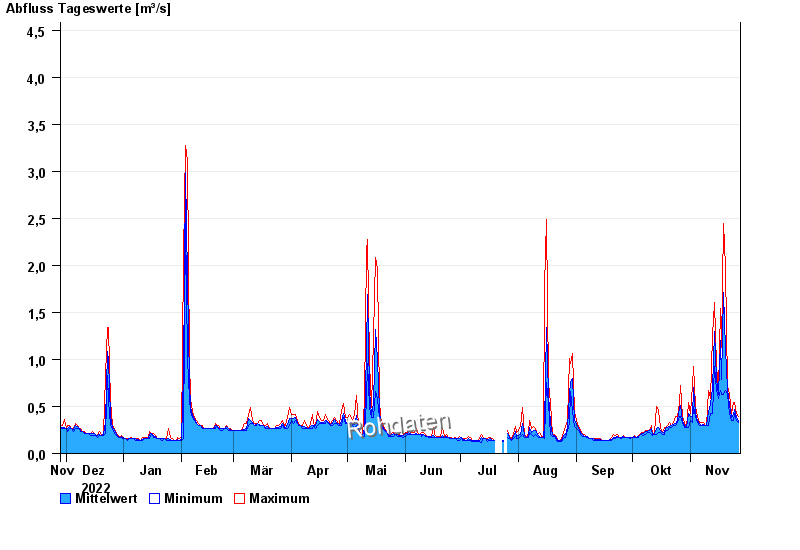
Chart of year Köfering / Pfatter
Discharge from 28.11.2022 to 27.11.2023
- 14.01.2011 Abfluss: 16,8 m³/s
- 02.03.1987 Abfluss: 12,1 m³/s
- 09.03.2006 Abfluss: 10,8 m³/s
- 16.03.1988 Abfluss: 10,5 m³/s
- 21.12.1993 Abfluss: 10,3 m³/s
| Date | Mean value [m³/s] | Maximum [m³/s] | Minimum [m³/s] |
|---|---|---|---|
| 27.11.2023 | 0.343 | 0.389 | 0.326 |
| 26.11.2023 | 0.386 | 0.424 | 0.356 |
| 25.11.2023 | 0.469 | 0.541 | 0.424 |
| 24.11.2023 | 0.419 | 0.541 | 0.356 |
| 23.11.2023 | 0.384 | 0.424 | 0.356 |
| 22.11.2023 | 0.516 | 0.627 | 0.424 |
| 21.11.2023 | 0.685 | 0.719 | 0.627 |
© Bayerisches Landesamt für Umwelt 2024