
- Start >
- Rivers >
- Discharge >
- Untere Donau >
- Köfering >
- Chart of year

Chart of year Köfering / Pfatter
Discharge from 02.12.2020 to 01.12.2021
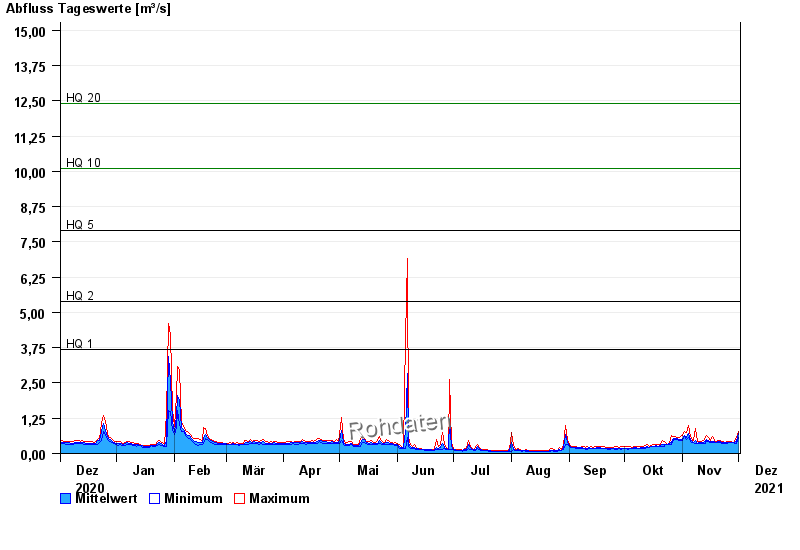
- HQ1 3,7 m³/s
- HQ2 5,4 m³/s
- HQ5 7,9 m³/s
- HQ10 10,1 m³/s
- HQ20 12,4 m³/s
- HQ50 15,9 m³/s
- HQ100 18,9 m³/s
| Date | Mean value [m³/s] | Maximum [m³/s] | Minimum [m³/s] |
|---|---|---|---|
| 01.12.2021 | 0.701 | 0.78 | 0.55 |
| 30.11.2021 | 0.412 | 0.55 | 0.365 |
| 29.11.2021 | 0.381 | 0.432 | 0.365 |
| 28.11.2021 | 0.398 | 0.398 | 0.398 |
| 27.11.2021 | 0.399 | 0.432 | 0.398 |
| 26.11.2021 | 0.399 | 0.432 | 0.398 |
| 25.11.2021 | 0.397 | 0.432 | 0.365 |
© Bayerisches Landesamt für Umwelt 2024