
- Start >
- Rivers >
- Discharge >
- Untere Donau >
- Köfering >
- Chart of year

Chart of year Köfering / Pfatter
Discharge from 01.01.2019 to 31.12.2019
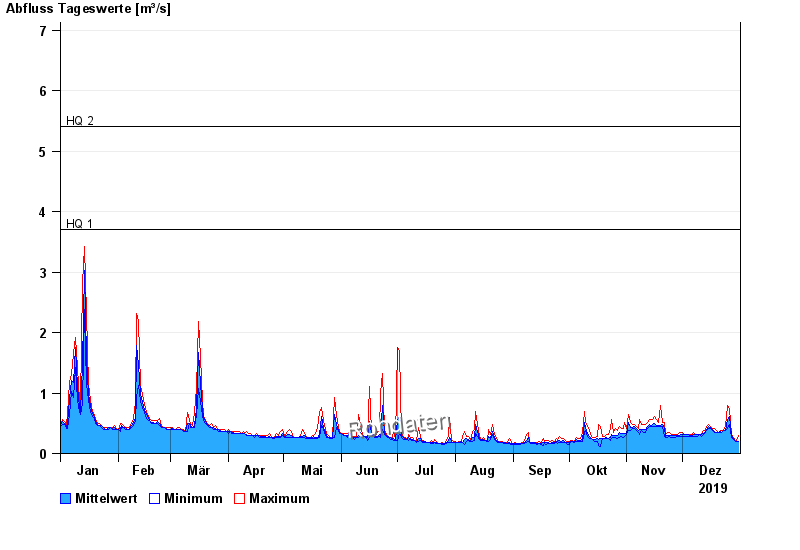
- HQ1 3,7 m³/s
- HQ2 5,4 m³/s
- HQ5 7,9 m³/s
- HQ10 10,1 m³/s
- HQ20 12,4 m³/s
- HQ50 15,9 m³/s
- HQ100 18,9 m³/s
| Date | Mean value [m³/s] | Maximum [m³/s] | Minimum [m³/s] |
|---|---|---|---|
| 31.12.2019 | 0.2 | 0.29 | 0.194 |
| 30.12.2019 | 0.203 | 0.215 | 0.194 |
| 29.12.2019 | 0.22 | 0.237 | 0.215 |
| 28.12.2019 | 0.243 | 0.262 | 0.237 |
| 27.12.2019 | 0.29 | 0.32 | 0.262 |
| 26.12.2019 | 0.605 | 0.743 | 0.479 |
| 25.12.2019 | 0.562 | 0.791 | 0.406 |
© Bayerisches Landesamt für Umwelt 2024