
- Start >
- Rivers >
- Discharge >
- Untere Donau >
- Kirchberg >
- Chart of year

Chart of year Kirchberg / Mertseebach
Discharge from 24.08.2019 to 23.08.2020
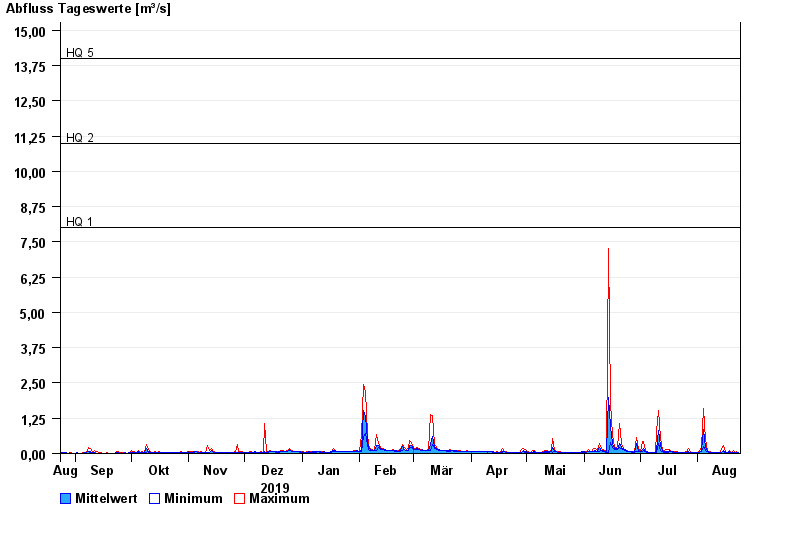
- HQ1 8 m³/s
- HQ2 11 m³/s
- HQ5 14 m³/s
- HQ10 18 m³/s
- HQ20 22 m³/s
- HQ50 28 m³/s
- HQ100 33 m³/s
| Date | Mean value [m³/s] | Maximum [m³/s] | Minimum [m³/s] |
|---|---|---|---|
| 23.08.2020 | 0.04 | 0.053 | 0.037 |
| 22.08.2020 | 0.04 | 0.073 | 0.029 |
| 21.08.2020 | 0.035 | 0.037 | 0.03 |
| 20.08.2020 | 0.041 | 0.107 | 0.03 |
| 19.08.2020 | 0.044 | 0.053 | 0.037 |
| 18.08.2020 | 0.062 | 0.107 | 0.037 |
| 17.08.2020 | 0.045 | 0.045 | 0.037 |
© Bayerisches Landesamt für Umwelt 2024