
- Start >
- Rivers >
- Discharge >
- Untere Donau >
- Kirchberg >
- Chart of total period

Chart of total period Kirchberg / Mertseebach
Discharge from 01.11.1985 to 27.04.2024
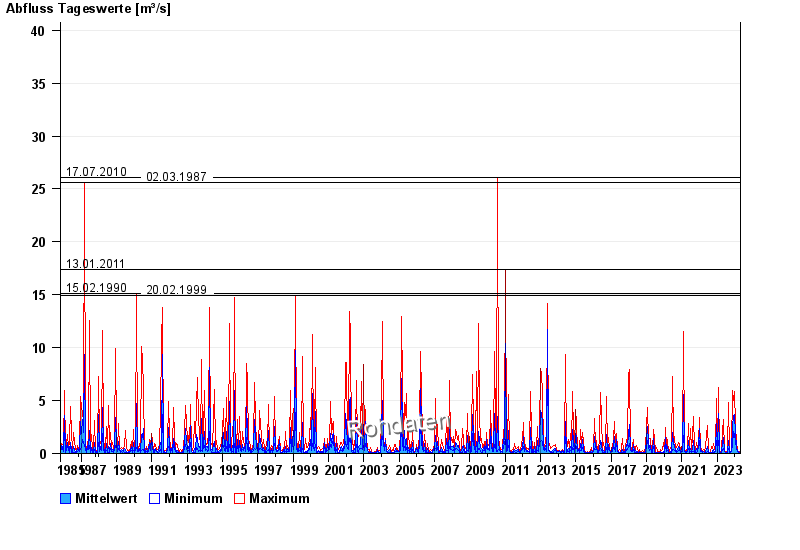
- 17.07.2010 Abfluss: 26,1 m³/s
- 02.03.1987 Abfluss: 25,6 m³/s
- 13.01.2011 Abfluss: 17,4 m³/s
- 15.02.1990 Abfluss: 15,1 m³/s
- 20.02.1999 Abfluss: 14,9 m³/s
| Date | Mean value [m³/s] | Maximum [m³/s] | Minimum [m³/s] |
|---|---|---|---|
| 27.04.2024 | 0.106 | 0.106 | 0.106 |
| 26.04.2024 | 0.11 | 0.119 | 0.106 |
| 25.04.2024 | 0.121 | 0.15 | 0.106 |
| 24.04.2024 | 0.108 | 0.119 | 0.106 |
| 23.04.2024 | 0.108 | 0.119 | 0.106 |
| 22.04.2024 | 0.121 | 0.134 | 0.106 |
| 21.04.2024 | 0.125 | 0.166 | 0.106 |
© Bayerisches Landesamt für Umwelt 2024