
- Start >
- Rivers >
- Discharge >
- Untere Donau >
- Kelheim >
- Chart of total period

Chart of total period Kelheim / Donau
Discharge from 01.11.1900 to 04.05.2024
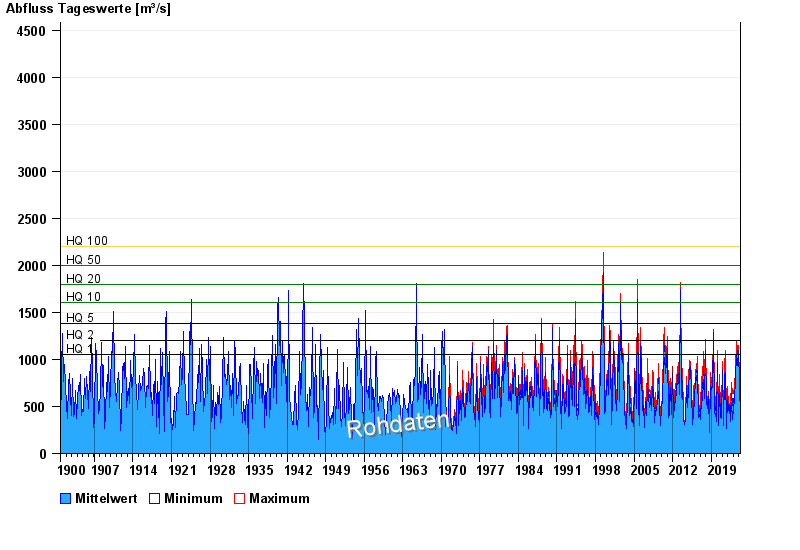
- HQ1 1050 m³/s
- HQ2 1200 m³/s
- HQ5 1380 m³/s
- HQ10 1600 m³/s
- HQ20 1800 m³/s
- HQ50 2000 m³/s
- HQ100 2200 m³/s
| Date | Mean value [m³/s] | Maximum [m³/s] | Minimum [m³/s] |
|---|---|---|---|
| 04.05.2024 | 311 | 317 | 304 |
| 03.05.2024 | 309 | 312 | 304 |
| 02.05.2024 | 308 | 312 | 301 |
| 01.05.2024 | 313 | 320 | 304 |
| 30.04.2024 | 312 | 327 | 294 |
| 29.04.2024 | 309 | 327 | 294 |
| 28.04.2024 | 296 | 317 | 284 |
© Bayerisches Landesamt für Umwelt 2024