
- Start >
- Rivers >
- Discharge >
- Untere Donau >
- Inkofen >
- Chart of year

Chart of year Inkofen / Amper
Discharge from 19.06.2019 to 18.06.2020
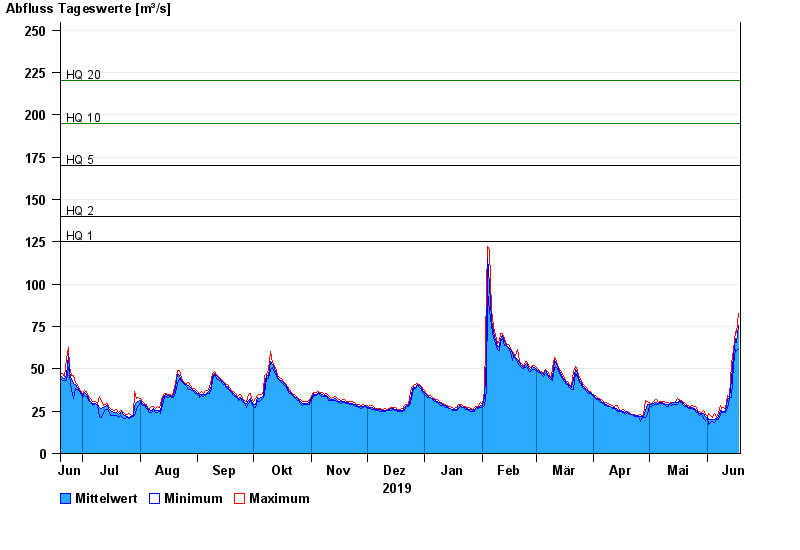
- HQ1 125 m³/s
- HQ2 140 m³/s
- HQ5 170 m³/s
- HQ10 195 m³/s
- HQ20 220 m³/s
- HQ50 255 m³/s
- HQ100 280 m³/s
| Date | Mean value [m³/s] | Maximum [m³/s] | Minimum [m³/s] |
|---|---|---|---|
| 18.06.2020 | 75.5 | 82.8 | 61.3 |
| 17.06.2020 | 65.3 | 71.2 | 61 |
| 16.06.2020 | 68.2 | 71.9 | 61.4 |
| 15.06.2020 | 58.1 | 61.5 | 52.4 |
| 14.06.2020 | 43.6 | 53.4 | 33.3 |
| 13.06.2020 | 33.3 | 33.7 | 32.5 |
| 12.06.2020 | 31.9 | 34.2 | 26.6 |
© Bayerisches Landesamt für Umwelt 2024