
- Start >
- Rivers >
- Discharge >
- Untere Donau >
- Inkofen >
- Chart of year

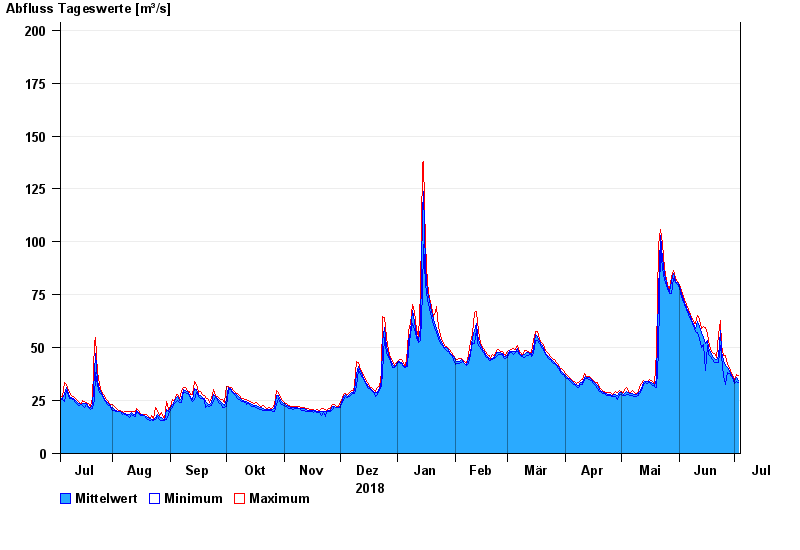
Chart of year Inkofen / Amper
Discharge from 04.07.2018 to 03.07.2019
- 15.04.1994 Abfluss: 249 m³/s
- 01.06.1940 Abfluss: 242 m³/s
- 11.07.1954 Abfluss: 240 m³/s
- 04.06.2013 Abfluss: 238 m³/s
- 13.06.1965 Abfluss: 223 m³/s
| Date | Mean value [m³/s] | Maximum [m³/s] | Minimum [m³/s] |
|---|---|---|---|
| 03.07.2019 | 34.6 | 36.7 | 33.7 |
| 02.07.2019 | 35.9 | 37.3 | 34.2 |
| 01.07.2019 | 34.2 | 34.9 | 33.2 |
| 30.06.2019 | 35.4 | 36.4 | 34.7 |
| 29.06.2019 | 37 | 38 | 36.4 |
| 28.06.2019 | 38.8 | 40.5 | 37.7 |
| 27.06.2019 | 40.5 | 42.1 | 38.5 |
© Bayerisches Landesamt für Umwelt 2024