
- Start >
- Rivers >
- Discharge >
- Untere Donau >
- Inkofen >
- Chart of year

Chart of year Inkofen / Amper
Discharge from 13.08.2020 to 12.08.2021
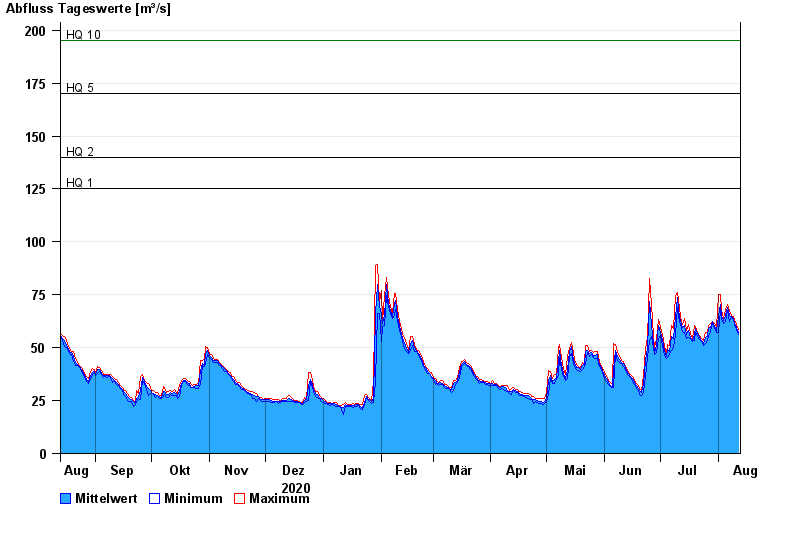
- HQ1 125 m³/s
- HQ2 140 m³/s
- HQ5 170 m³/s
- HQ10 195 m³/s
- HQ20 220 m³/s
- HQ50 255 m³/s
- HQ100 280 m³/s
| Date | Mean value [m³/s] | Maximum [m³/s] | Minimum [m³/s] |
|---|---|---|---|
| 12.08.2021 | 57.3 | 58.8 | 56 |
| 11.08.2021 | 59.7 | 61 | 58.8 |
| 10.08.2021 | 61.6 | 63 | 60.9 |
| 09.08.2021 | 63.6 | 64.9 | 63 |
| 08.08.2021 | 64.9 | 65.3 | 64.6 |
| 07.08.2021 | 65.2 | 67.7 | 62.2 |
| 06.08.2021 | 68.9 | 70.3 | 67.7 |
© Bayerisches Landesamt für Umwelt 2024