
- Start >
- Rivers >
- Discharge >
- Untere Donau >
- Hörmannsberg >
- Chart of year

Chart of year Hörmannsberg / Gaißa
Discharge from 09.02.2023 to 08.02.2024
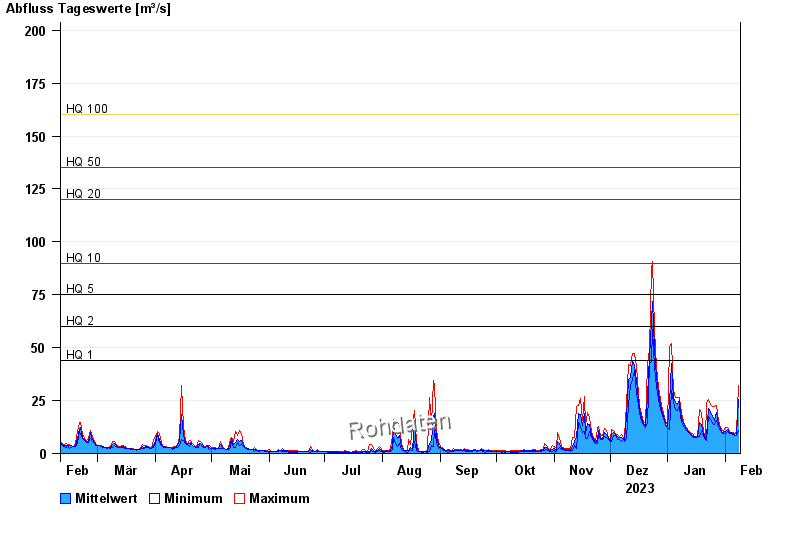
- HQ1 44 m³/s
- HQ2 60 m³/s
- HQ5 75 m³/s
- HQ10 90 m³/s
- HQ20 120 m³/s
- HQ50 135 m³/s
- HQ100 160 m³/s
| Date | Mean value [m³/s] | Maximum [m³/s] | Minimum [m³/s] |
|---|---|---|---|
| 08.02.2024 | 25.4 | 32.1 | 10.7 |
| 07.02.2024 | 8.52 | 10.5 | 8.38 |
| 06.02.2024 | 8.49 | 8.95 | 8.38 |
| 05.02.2024 | 9.51 | 10.1 | 8.95 |
| 04.02.2024 | 9.75 | 10.1 | 9.33 |
| 03.02.2024 | 9.66 | 10.3 | 9.33 |
| 02.02.2024 | 11.4 | 12.5 | 10.3 |
© Bayerisches Landesamt für Umwelt 2024