
- Start >
- Rivers >
- Discharge >
- Untere Donau >
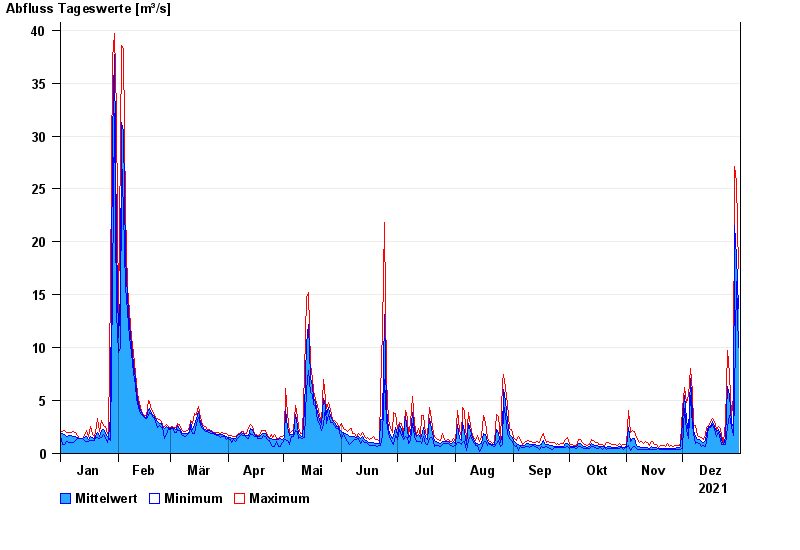
- Hörmannsberg >
- Chart of year

Chart of year Hörmannsberg / Gaißa
Discharge from 01.01.2021 to 31.12.2021
| Date | Mean value [m³/s] | Maximum [m³/s] | Minimum [m³/s] |
|---|---|---|---|
| 31.12.2021 | 13.7 | 17.5 | 9.98 |
| 30.12.2021 | 18.6 | 25.7 | 16.3 |
| 29.12.2021 | 21.5 | 27.1 | 5.39 |
| 28.12.2021 | 2.43 | 5.39 | 1.7 |
| 27.12.2021 | 2.82 | 3.56 | 2.44 |
| 26.12.2021 | 5.44 | 7.49 | 3.56 |
| 25.12.2021 | 6.37 | 9.77 | 2.55 |
© Bayerisches Landesamt für Umwelt 2024