
- Start >
- Rivers >
- Discharge >
- Untere Donau >
- Hörmannsberg >
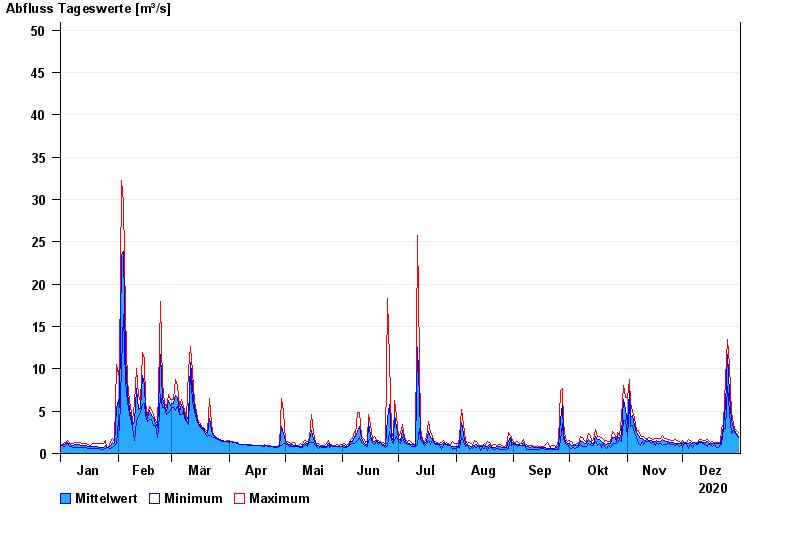
- Chart of year

Chart of year Hörmannsberg / Gaißa
Discharge from 01.01.2020 to 31.12.2020
- 01.02.1985 Abfluss: 139 m³/s
- 23.02.1970 Abfluss: 116 m³/s
- 16.08.1958 Abfluss: 97,6 m³/s
- 11.01.1976 Abfluss: 92,6 m³/s
- 31.01.1982 Abfluss: 90,3 m³/s
| Date | Mean value [m³/s] | Maximum [m³/s] | Minimum [m³/s] |
|---|---|---|---|
| 31.12.2020 | 2.05 | 2.44 | 1.9 |
| 30.12.2020 | 2.39 | 2.68 | 2.21 |
| 29.12.2020 | 2.7 | 2.92 | 2.44 |
| 28.12.2020 | 3.02 | 3.44 | 2.68 |
| 27.12.2020 | 3.95 | 4.88 | 2.33 |
| 26.12.2020 | 6.94 | 10.4 | 4.88 |
| 25.12.2020 | 11.7 | 13.5 | 7.96 |
© Bayerisches Landesamt für Umwelt 2024