
- Start >
- Rivers >
- Discharge >
- Untere Donau >
- Hörmannsberg >
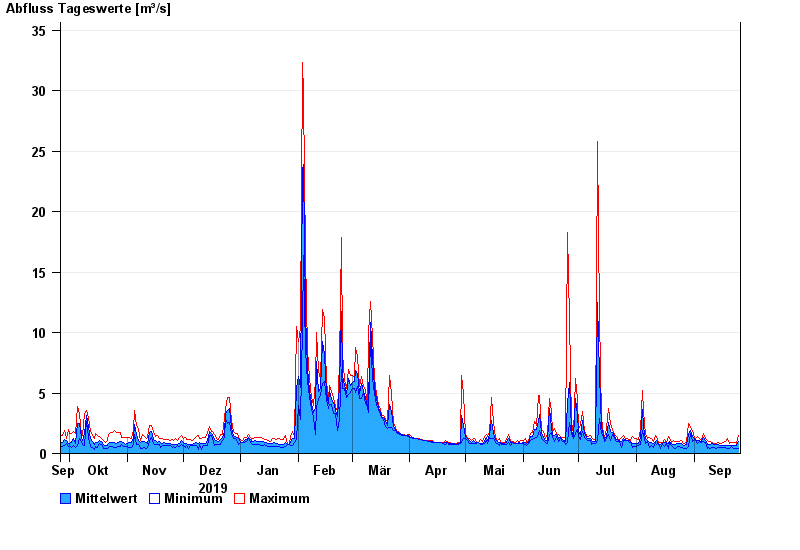
- Chart of year

Chart of year Hörmannsberg / Gaißa
Discharge from 26.09.2019 to 25.09.2020
| Date | Mean value [m³/s] | Maximum [m³/s] | Minimum [m³/s] |
|---|---|---|---|
| 25.09.2020 | 0.952 | 1.52 | 0.452 |
| 24.09.2020 | 0.68 | 0.818 | 0.451 |
| 23.09.2020 | 0.638 | 0.948 | 0.45 |
| 22.09.2020 | 0.626 | 0.946 | 0.449 |
| 21.09.2020 | 0.665 | 0.877 | 0.538 |
| 20.09.2020 | 0.632 | 0.811 | 0.447 |
| 19.09.2020 | 0.645 | 1.25 | 0.446 |
© Bayerisches Landesamt für Umwelt 2024