
- Start >
- Rivers >
- Discharge >
- Untere Donau >
- Hörmannsberg >
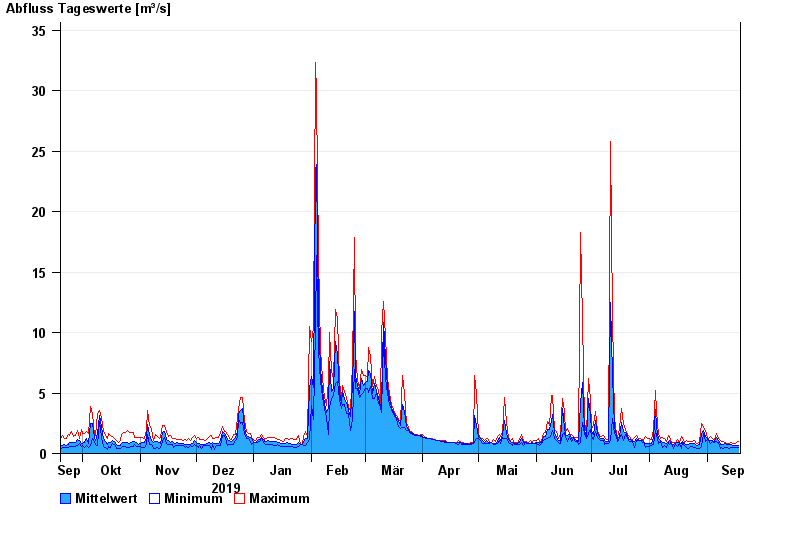
- Chart of year

Chart of year Hörmannsberg / Gaißa
Discharge from 19.09.2019 to 18.09.2020
| Date | Mean value [m³/s] | Maximum [m³/s] | Minimum [m³/s] |
|---|---|---|---|
| 18.09.2020 | 0.661 | 1.01 | 0.489 |
| 17.09.2020 | 0.702 | 0.87 | 0.533 |
| 16.09.2020 | 0.667 | 0.866 | 0.532 |
| 15.09.2020 | 0.68 | 0.866 | 0.531 |
| 14.09.2020 | 0.722 | 0.929 | 0.484 |
| 13.09.2020 | 0.717 | 0.862 | 0.44 |
| 12.09.2020 | 0.765 | 0.86 | 0.527 |
© Bayerisches Landesamt für Umwelt 2024