
- Start >
- Rivers >
- Discharge >
- Untere Donau >
- Hörmannsberg >
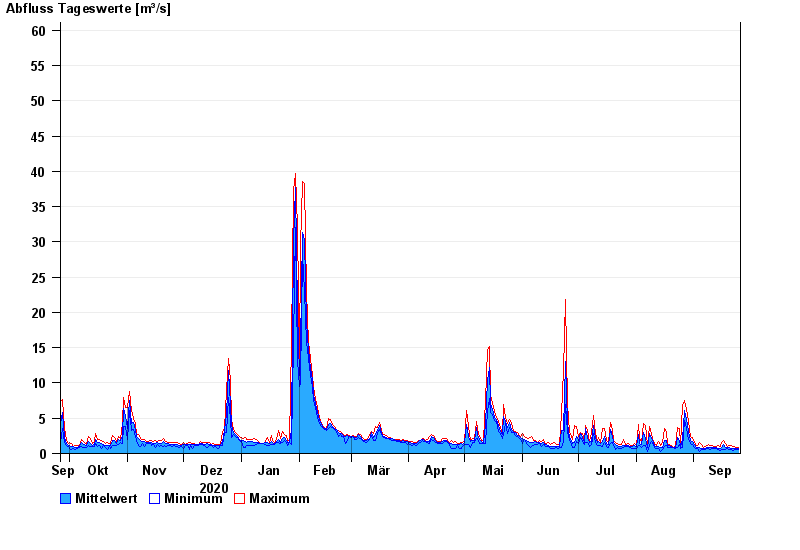
- Chart of year

Chart of year Hörmannsberg / Gaißa
Discharge from 26.09.2020 to 25.09.2021
- 01.02.1985 Abfluss: 139 m³/s
- 23.02.1970 Abfluss: 116 m³/s
- 16.08.1958 Abfluss: 97,6 m³/s
- 11.01.1976 Abfluss: 92,6 m³/s
- 31.01.1982 Abfluss: 90,3 m³/s
| Date | Mean value [m³/s] | Maximum [m³/s] | Minimum [m³/s] |
|---|---|---|---|
| 25.09.2021 | 0.704 | 0.915 | 0.536 |
| 24.09.2021 | 0.7 | 0.862 | 0.544 |
| 23.09.2021 | 0.698 | 0.994 | 0.544 |
| 22.09.2021 | 0.724 | 1 | 0.391 |
| 21.09.2021 | 0.751 | 1.07 | 0.51 |
| 20.09.2021 | 0.806 | 1.15 | 0.557 |
| 19.09.2021 | 0.813 | 1.02 | 0.656 |
© Bayerisches Landesamt für Umwelt 2024