
- Start >
- Rivers >
- Discharge >
- Untere Donau >
- Hörmannsberg >
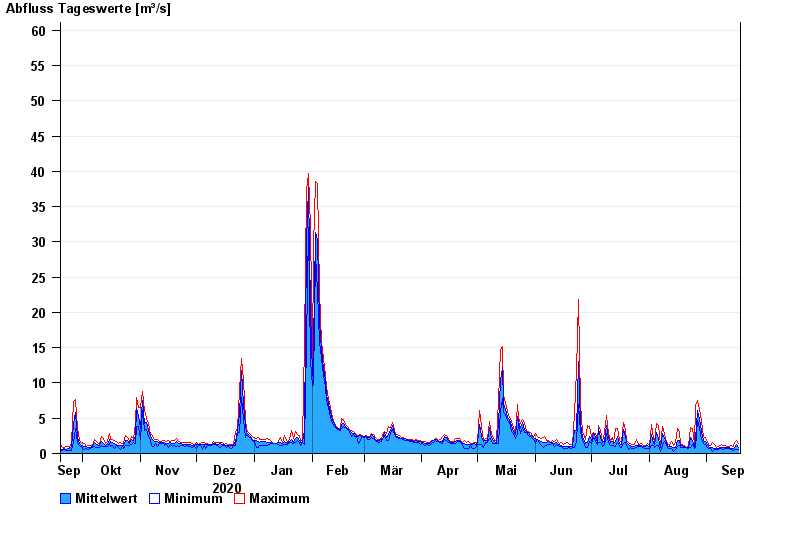
- Chart of year

Chart of year Hörmannsberg / Gaißa
Discharge from 19.09.2020 to 18.09.2021
- 01.02.1985 Abfluss: 139 m³/s
- 23.02.1970 Abfluss: 116 m³/s
- 16.08.1958 Abfluss: 97,6 m³/s
- 11.01.1976 Abfluss: 92,6 m³/s
- 31.01.1982 Abfluss: 90,3 m³/s
| Date | Mean value [m³/s] | Maximum [m³/s] | Minimum [m³/s] |
|---|---|---|---|
| 18.09.2021 | 0.905 | 1.4 | 0.612 |
| 17.09.2021 | 1.26 | 1.86 | 0.524 |
| 16.09.2021 | 0.839 | 1.58 | 0.619 |
| 15.09.2021 | 0.778 | 1.05 | 0.411 |
| 14.09.2021 | 0.774 | 1.12 | 0.533 |
| 13.09.2021 | 0.813 | 1.05 | 0.683 |
| 12.09.2021 | 0.835 | 0.994 | 0.741 |
© Bayerisches Landesamt für Umwelt 2024