
- Start >
- Rivers >
- Discharge >
- Untere Donau >
- Hörmannsberg >
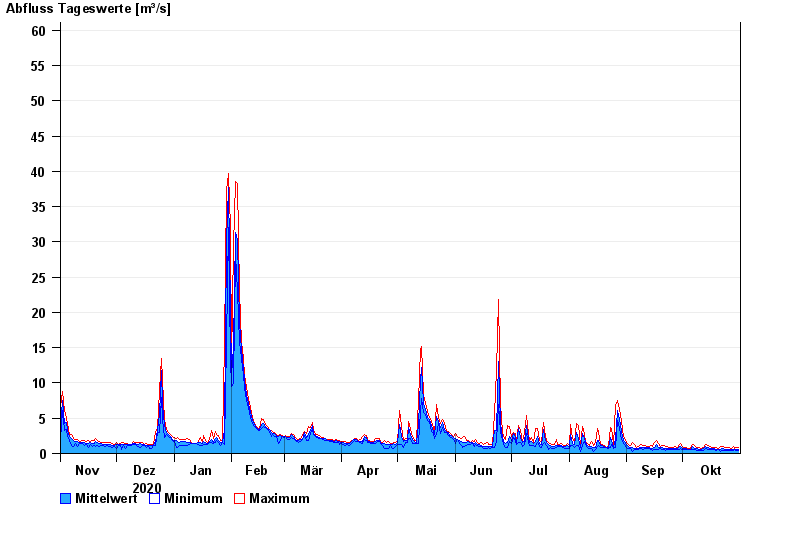
- Chart of year

Chart of year Hörmannsberg / Gaißa
Discharge from 01.11.2020 to 31.10.2021
- 01.02.1985 Abfluss: 139 m³/s
- 23.02.1970 Abfluss: 116 m³/s
- 16.08.1958 Abfluss: 97,6 m³/s
- 11.01.1976 Abfluss: 92,6 m³/s
- 31.01.1982 Abfluss: 90,3 m³/s
| Date | Mean value [m³/s] | Maximum [m³/s] | Minimum [m³/s] |
|---|---|---|---|
| 31.10.2021 | 0.603 | 0.828 | 0.48 |
| 30.10.2021 | 0.609 | 0.887 | 0.404 |
| 29.10.2021 | 0.615 | 0.713 | 0.521 |
| 28.10.2021 | 0.624 | 0.949 | 0.44 |
| 27.10.2021 | 0.587 | 0.768 | 0.44 |
| 26.10.2021 | 0.596 | 0.885 | 0.439 |
| 25.10.2021 | 0.605 | 0.884 | 0.477 |
© Bayerisches Landesamt für Umwelt 2024