
- Start >
- Rivers >
- Discharge >
- Untere Donau >
- Hörmannsberg >
- Chart of year

Chart of year Hörmannsberg / Gaißa
Discharge from 23.09.2020 to 22.09.2021
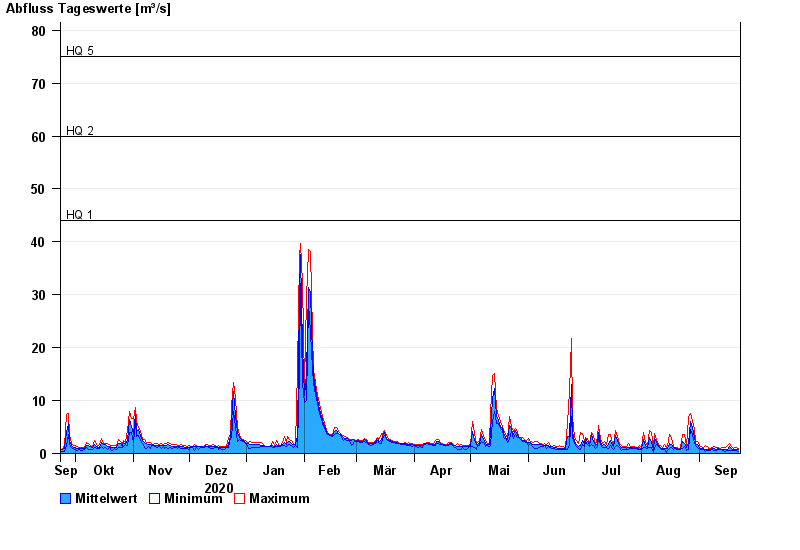
- HQ1 44 m³/s
- HQ2 60 m³/s
- HQ5 75 m³/s
- HQ10 90 m³/s
- HQ20 120 m³/s
- HQ50 135 m³/s
- HQ100 160 m³/s
| Date | Mean value [m³/s] | Maximum [m³/s] | Minimum [m³/s] |
|---|---|---|---|
| 22.09.2021 | 0.724 | 1 | 0.391 |
| 21.09.2021 | 0.751 | 1.07 | 0.51 |
| 20.09.2021 | 0.806 | 1.15 | 0.557 |
| 19.09.2021 | 0.813 | 1.02 | 0.656 |
| 18.09.2021 | 0.905 | 1.4 | 0.612 |
| 17.09.2021 | 1.26 | 1.86 | 0.524 |
| 16.09.2021 | 0.839 | 1.58 | 0.619 |
© Bayerisches Landesamt für Umwelt 2024