
- Start >
- Rivers >
- Discharge >
- Untere Donau >
- Hörmannsberg >
- Chart of year

Chart of year Hörmannsberg / Gaißa
Discharge from 20.04.2024 to 19.04.2025
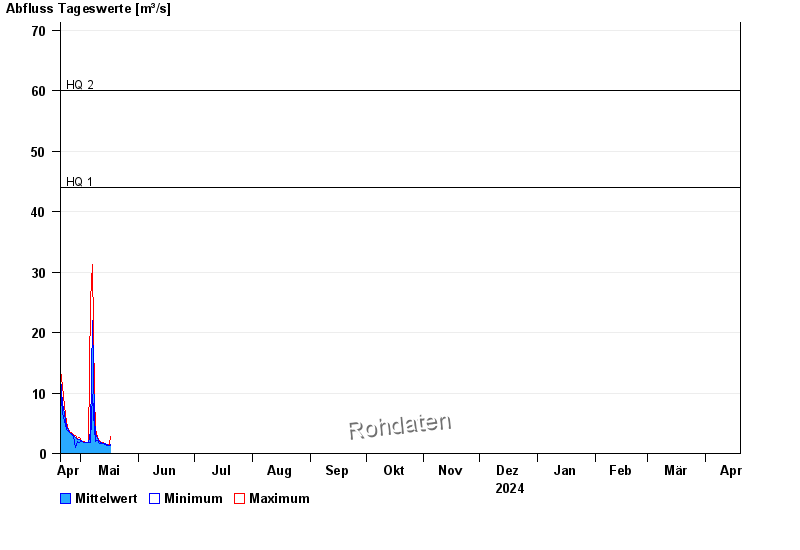
- HQ1 44 m³/s
- HQ2 60 m³/s
- HQ5 75 m³/s
- HQ10 90 m³/s
- HQ20 120 m³/s
- HQ50 135 m³/s
- HQ100 160 m³/s
| Date | Mean value [m³/s] | Maximum [m³/s] | Minimum [m³/s] |
|---|---|---|---|
| 02.05.2024 | 2.02 | 2.06 | 1.96 |
| 01.05.2024 | 2.15 | 2.17 | 2.06 |
| 30.04.2024 | 2.28 | 2.61 | 1.77 |
| 29.04.2024 | 2.28 | 2.49 | 1.96 |
| 28.04.2024 | 2.6 | 2.97 | 0.934 |
| 27.04.2024 | 3.03 | 3.22 | 2.84 |
| 26.04.2024 | 3.35 | 3.48 | 3.09 |
© Bayerisches Landesamt für Umwelt 2024