
- Start >
- Rivers >
- Discharge >
- Untere Donau >
- Hörmannsberg >
- Chart of year

Chart of year Hörmannsberg / Gaißa
Discharge from 01.11.2021 to 31.10.2022
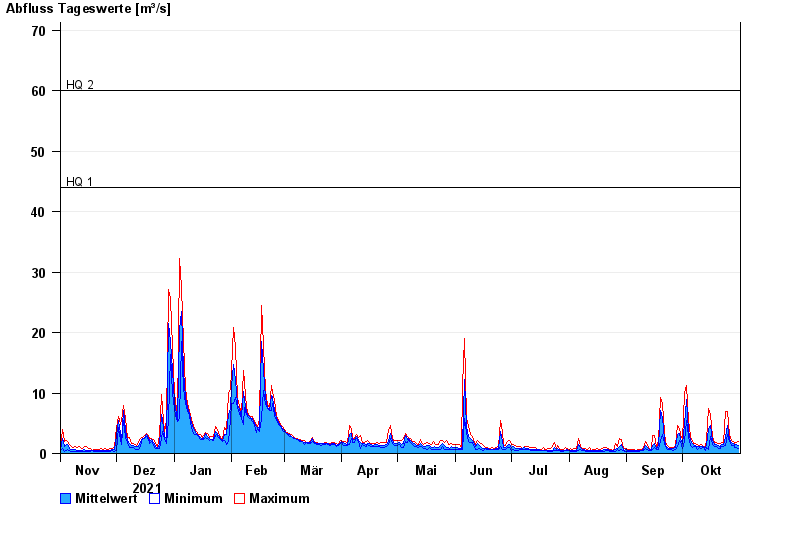
- HQ1 44 m³/s
- HQ2 60 m³/s
- HQ5 75 m³/s
- HQ10 90 m³/s
- HQ20 120 m³/s
- HQ50 135 m³/s
- HQ100 160 m³/s
| Date | Mean value [m³/s] | Maximum [m³/s] | Minimum [m³/s] |
|---|---|---|---|
| 31.10.2022 | 1.34 | 2.04 | 0.824 |
| 30.10.2022 | 1.43 | 1.74 | 0.945 |
| 29.10.2022 | 1.36 | 1.64 | 1.01 |
| 28.10.2022 | 1.6 | 2.02 | 1.3 |
| 27.10.2022 | 1.76 | 2.22 | 1.29 |
| 26.10.2022 | 2.34 | 3.16 | 2.01 |
| 25.10.2022 | 4.55 | 6.89 | 3.16 |
© Bayerisches Landesamt für Umwelt 2024