
- Start >
- Rivers >
- Discharge >
- Untere Donau >
- Hörmannsberg >
- Chart of year

Chart of year Hörmannsberg / Gaißa
Discharge from 01.11.2019 to 31.10.2020
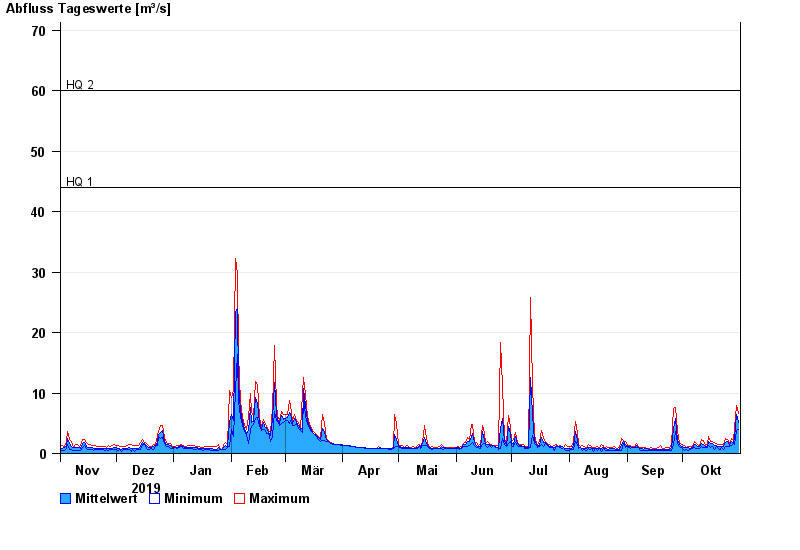
- HQ1 44 m³/s
- HQ2 60 m³/s
- HQ5 75 m³/s
- HQ10 90 m³/s
- HQ20 120 m³/s
- HQ50 135 m³/s
- HQ100 160 m³/s
| Date | Mean value [m³/s] | Maximum [m³/s] | Minimum [m³/s] |
|---|---|---|---|
| 31.10.2020 | 5.19 | 6.56 | 3.89 |
| 30.10.2020 | 6.39 | 8 | 3.88 |
| 29.10.2020 | 2.41 | 4.31 | 1.43 |
| 28.10.2020 | 1.82 | 2.12 | 1.62 |
| 27.10.2020 | 2.02 | 2.46 | 1.25 |
| 26.10.2020 | 1.38 | 1.71 | 1.17 |
| 25.10.2020 | 1.91 | 2.33 | 1.17 |
© Bayerisches Landesamt für Umwelt 2024