
- Start >
- Rivers >
- Discharge >
- Untere Donau >
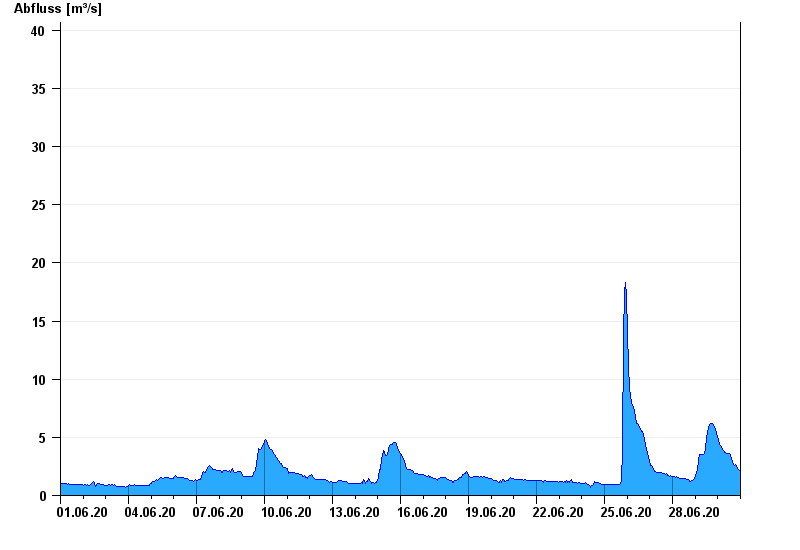
- Hörmannsberg >
- Chart of month

Chart of month Hörmannsberg / Gaißa
Discharge from 01.06.2020 to 30.06.2020
- HQ1 44 m³/s
- HQ2 60 m³/s
- HQ5 75 m³/s
- HQ10 90 m³/s
- HQ20 120 m³/s
- HQ50 135 m³/s
- HQ100 160 m³/s
| Date | Runoff [m³/s] |
|---|---|
| 01.07.2020 00:45 | 2.02 |
| 01.07.2020 00:30 | 2.02 |
| 01.07.2020 00:15 | 2.02 |
| 01.07.2020 00:00 | 2.02 |
| 30.06.2020 23:45 | 2.02 |
| 30.06.2020 23:30 | 2.13 |
| 30.06.2020 23:15 | 2.02 |
© Bayerisches Landesamt für Umwelt 2024