
- Start >
- Rivers >
- Discharge >
- Untere Donau >
- Heuweg >
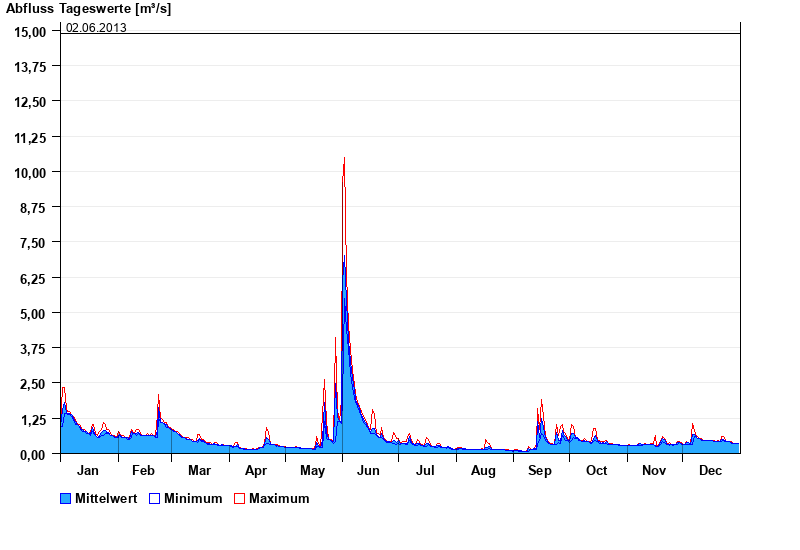
- Chart of year

Chart of year Heuweg / Otterbach
Discharge from 01.01.2024 to 31.12.2024
- 25.03.1988 Abfluss: 18,5 m³/s
- 26.01.1971 Abfluss: 17,3 m³/s
- 09.02.1987 Abfluss: 16,8 m³/s
- 31.05.2013 Abfluss: 15,3 m³/s
- 02.06.2013 Abfluss: 14,9 m³/s
| Date | Mean value [m³/s] | Maximum [m³/s] | Minimum [m³/s] |
|---|---|---|---|
| 31.12.2024 | 0.354 | 0.354 | 0.354 |
| 30.12.2024 | 0.355 | 0.355 | 0.354 |
| 29.12.2024 | 0.356 | 0.356 | 0.355 |
| 28.12.2024 | 0.356 | 0.357 | 0.356 |
| 27.12.2024 | 0.374 | 0.408 | 0.357 |
| 26.12.2024 | 0.409 | 0.409 | 0.408 |
| 25.12.2024 | 0.41 | 0.41 | 0.409 |
© Bayerisches Landesamt für Umwelt 2025