
- Start >
- Rivers >
- Discharge >
- Untere Donau >
- Heitzenhofen >
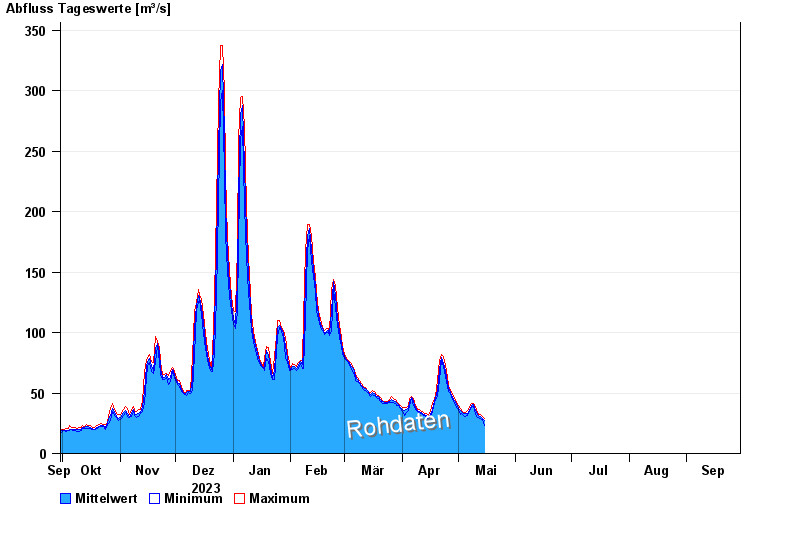
- Chart of year

Chart of year Heitzenhofen / Naab
Discharge from 30.09.2023 to 29.09.2024
| Date | Mean value [m³/s] | Maximum [m³/s] | Minimum [m³/s] |
|---|---|---|---|
| 16.06.2024 | 42.8 | 42.8 | 42.8 |
| 15.06.2024 | 43.2 | 45.1 | 42.2 |
| 14.06.2024 | 46.1 | 47.5 | 43.9 |
| 13.06.2024 | 48.3 | 49.9 | 43.9 |
| 12.06.2024 | 51.6 | 54.9 | 49.9 |
| 11.06.2024 | 57.9 | 60.1 | 54.9 |
| 10.06.2024 | 64 | 69.5 | 60.1 |
© Bayerisches Landesamt für Umwelt 2024