
- Start >
- Rivers >
- Discharge >
- Untere Donau >
- Heitzenhofen >
- Chart of year

Chart of year Heitzenhofen / Naab
Discharge from 30.03.2024 to 29.03.2025
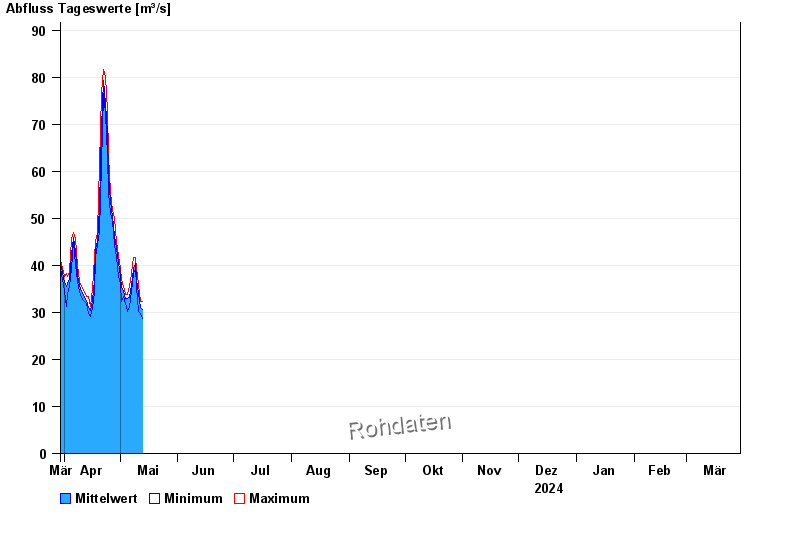
| Date | Mean value [m³/s] | Maximum [m³/s] | Minimum [m³/s] |
|---|---|---|---|
| 28.04.2024 | 48 | 49.9 | 45.1 |
| 27.04.2024 | 50.3 | 51.7 | 49.3 |
| 26.04.2024 | 53.6 | 55.5 | 51.1 |
| 25.04.2024 | 59.1 | 63.4 | 55.5 |
| 24.04.2024 | 68.1 | 73 | 63.4 |
| 23.04.2024 | 74.5 | 80.1 | 72.3 |
| 22.04.2024 | 79.4 | 81.6 | 76.5 |
© Bayerisches Landesamt für Umwelt 2024