
- Start >
- Rivers >
- Discharge >
- Untere Donau >
- Heitzenhofen >
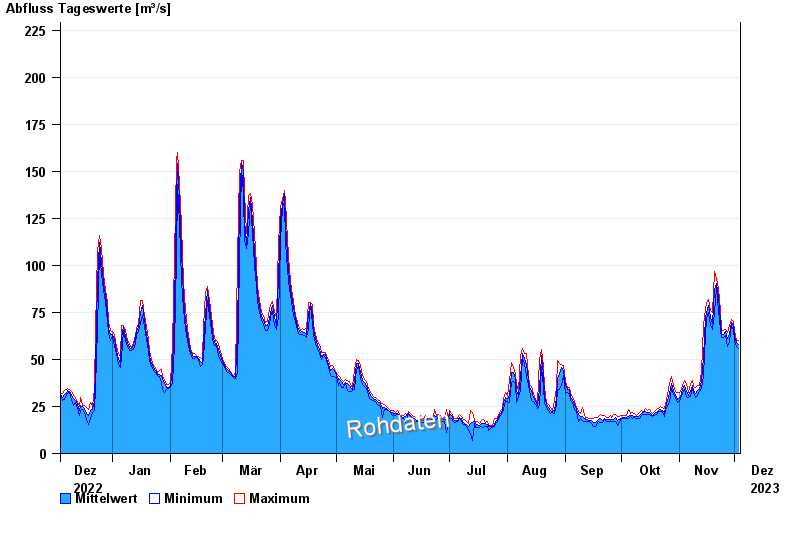
- Chart of year

Chart of year Heitzenhofen / Naab
Discharge from 04.12.2022 to 03.12.2023
- 06.02.1909 Abfluss: 950 m³/s
- 30.12.1947 Abfluss: 765 m³/s
- 12.07.1954 Abfluss: 730 m³/s
- 16.01.2011 Abfluss: 715 m³/s
- 28.03.1988 Abfluss: 611 m³/s
| Date | Mean value [m³/s] | Maximum [m³/s] | Minimum [m³/s] |
|---|---|---|---|
| 03.12.2023 | 57.8 | 60.1 | 55.6 |
| 02.12.2023 | 58.9 | 60.1 | 56.9 |
| 01.12.2023 | 62 | 65.5 | 60.1 |
| 30.11.2023 | 68 | 70.2 | 65.5 |
| 29.11.2023 | 69.7 | 71 | 68.2 |
| 28.11.2023 | 63 | 68.2 | 59.5 |
| 27.11.2023 | 61 | 64.1 | 56.9 |
© Bayerisches Landesamt für Umwelt 2024