
- Start >
- Rivers >
- Discharge >
- Untere Donau >
- Hammermühle >
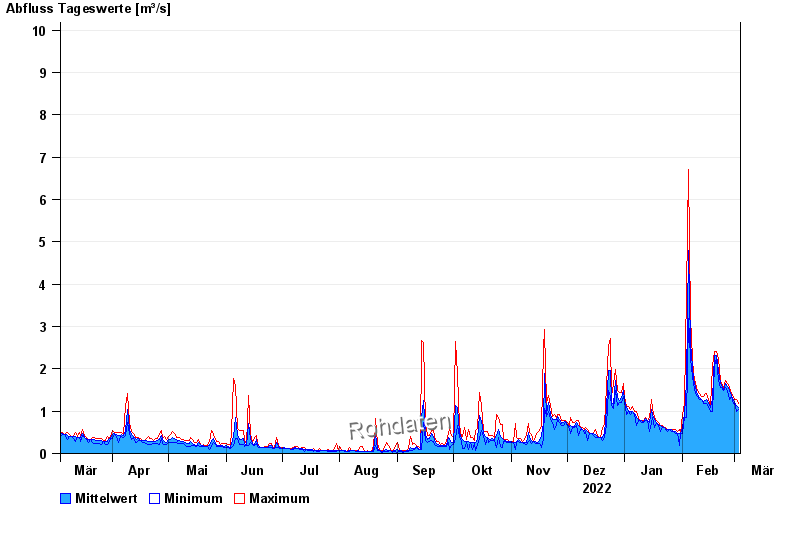
- Chart of year

Chart of year Hammermühle / Otterbach
Discharge from 04.03.2022 to 03.03.2023
- 31.05.2013 Abfluss: 32,1 m³/s
- 03.06.2013 Abfluss: 30,6 m³/s
- 21.12.1993 Abfluss: 29,7 m³/s
- 25.03.1988 Abfluss: 25,9 m³/s
- 02.02.1985 Abfluss: 24,1 m³/s
| Date | Mean value [m³/s] | Maximum [m³/s] | Minimum [m³/s] |
|---|---|---|---|
| 03.03.2023 | 1.09 | 1.19 | 1.05 |
| 02.03.2023 | 1.14 | 1.27 | 0.983 |
| 01.03.2023 | 1.2 | 1.27 | 1.19 |
| 28.02.2023 | 1.25 | 1.34 | 1.19 |
| 27.02.2023 | 1.36 | 1.42 | 1.34 |
| 26.02.2023 | 1.48 | 1.57 | 1.27 |
| 25.02.2023 | 1.58 | 1.65 | 1.5 |
© Bayerisches Landesamt für Umwelt 2024