
- Start >
- Rivers >
- Discharge >
- Untere Donau >
- Hammermühle >
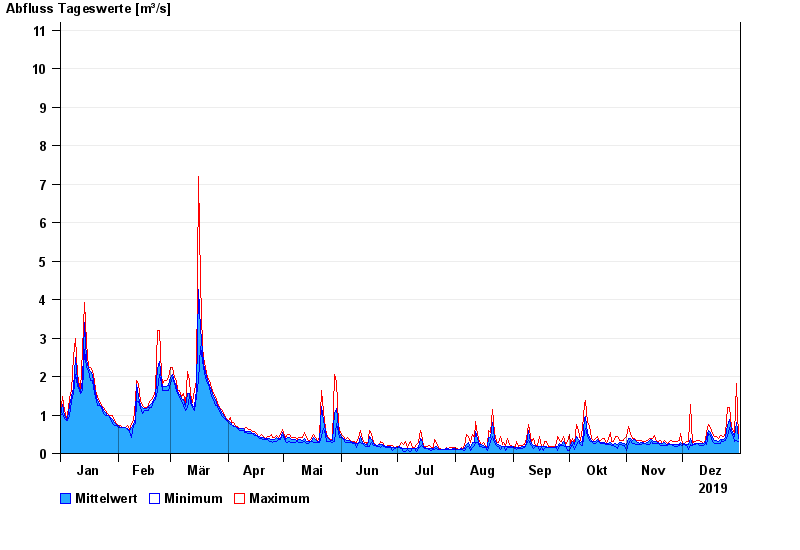
- Chart of year

Chart of year Hammermühle / Otterbach
Discharge from 01.01.2019 to 31.12.2019
- 31.05.2013 Abfluss: 32,1 m³/s
- 03.06.2013 Abfluss: 30,6 m³/s
- 21.12.1993 Abfluss: 29,7 m³/s
- 25.03.1988 Abfluss: 25,9 m³/s
- 02.02.1985 Abfluss: 24,1 m³/s
| Date | Mean value [m³/s] | Maximum [m³/s] | Minimum [m³/s] |
|---|---|---|---|
| 31.12.2019 | 0.39 | 0.428 | 0.301 |
| 30.12.2019 | 0.808 | 1.83 | 0.341 |
| 29.12.2019 | 0.445 | 0.526 | 0.301 |
| 28.12.2019 | 0.497 | 0.578 | 0.428 |
| 27.12.2019 | 0.621 | 0.687 | 0.526 |
| 26.12.2019 | 0.896 | 1.2 | 0.687 |
| 25.12.2019 | 0.734 | 1.2 | 0.429 |
© Bayerisches Landesamt für Umwelt 2024