
- Start >
- Rivers >
- Discharge >
- Untere Donau >
- Hammermühle >
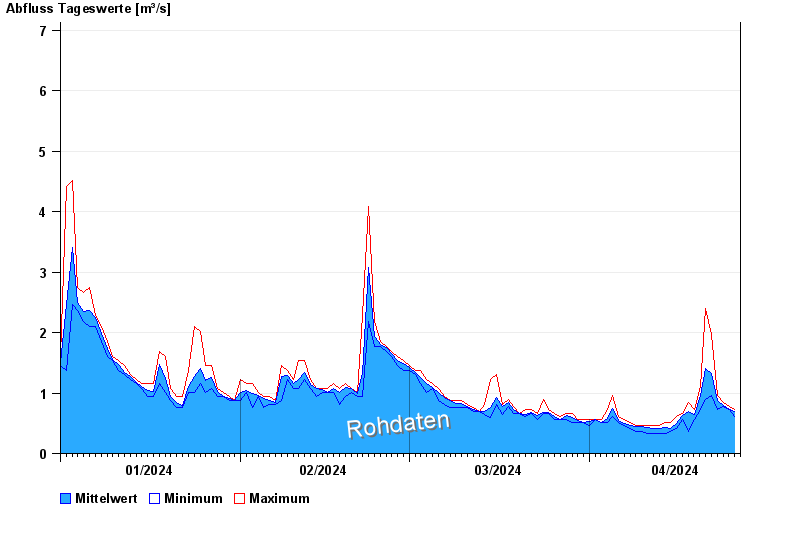
- Chart of year

Chart of year Hammermühle / Otterbach
Discharge from 01.01.2024 to 26.04.2024
- 31.05.2013 Abfluss: 32,1 m³/s
- 03.06.2013 Abfluss: 30,6 m³/s
- 21.12.1993 Abfluss: 29,7 m³/s
- 25.03.1988 Abfluss: 25,9 m³/s
- 02.02.1985 Abfluss: 24,1 m³/s
| Date | Mean value [m³/s] | Maximum [m³/s] | Minimum [m³/s] |
|---|---|---|---|
| 26.04.2024 | 0.72 | 0.72 | 0.72 |
| 25.04.2024 | 0.732 | 0.776 | 0.72 |
| 24.04.2024 | 0.792 | 0.838 | 0.776 |
| 23.04.2024 | 0.876 | 0.967 | 0.72 |
| 22.04.2024 | 1.32 | 1.96 | 0.967 |
| 21.04.2024 | 1.41 | 2.4 | 0.901 |
| 20.04.2024 | 0.953 | 1.11 | 0.72 |
© Bayerisches Landesamt für Umwelt 2024