
- Start >
- Rivers >
- Discharge >
- Untere Donau >
- Haberkofen >
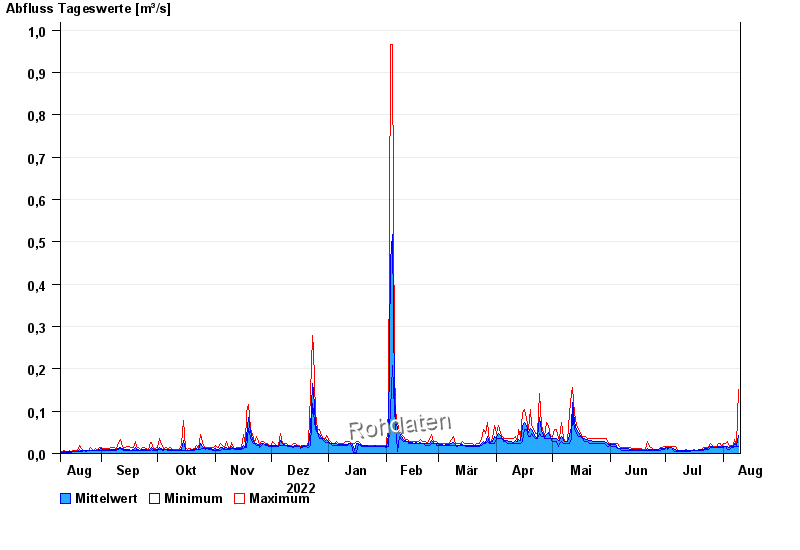
- Chart of year

Chart of year Haberkofen / Ödbach
Discharge from 10.08.2022 to 09.08.2023
- 07.02.2012 Abfluss: 5,3 m³/s
- 03.06.2013 Abfluss: 3,29 m³/s
- 17.02.2006 Abfluss: 3,17 m³/s
- 20.07.1993 Abfluss: 3,1 m³/s
- 02.06.1995 Abfluss: 3,08 m³/s
| Date | Mean value [m³/s] | Maximum [m³/s] | Minimum [m³/s] |
|---|---|---|---|
| 09.08.2023 | 0.044 | 0.152 | 0.016 |
| 08.08.2023 | 0.018 | 0.019 | 0.016 |
| 07.08.2023 | 0.024 | 0.034 | 0.016 |
| 06.08.2023 | 0.017 | 0.019 | 0.013 |
| 05.08.2023 | 0.015 | 0.019 | 0.013 |
| 04.08.2023 | 0.014 | 0.016 | 0.01 |
| 03.08.2023 | 0.017 | 0.028 | 0.01 |
© Bayerisches Landesamt für Umwelt 2024