
- Start >
- Rivers >
- Discharge >
- Untere Donau >
- Haberkofen >
- Chart of year

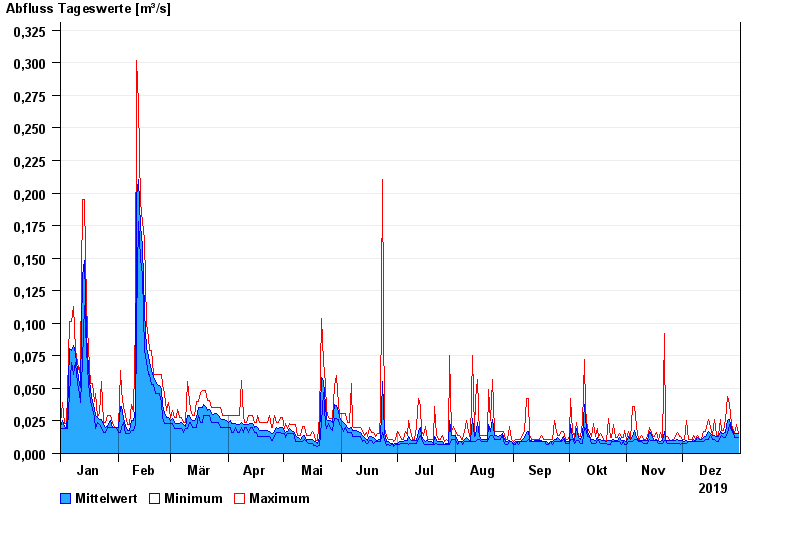
Chart of year Haberkofen / Ödbach
Discharge from 01.01.2019 to 31.12.2019
| Date | Mean value [m³/s] | Maximum [m³/s] | Minimum [m³/s] |
|---|---|---|---|
| 31.12.2019 | 0.015 | 0.015 | 0.012 |
| 30.12.2019 | 0.015 | 0.022 | 0.012 |
| 29.12.2019 | 0.015 | 0.015 | 0.012 |
| 28.12.2019 | 0.016 | 0.018 | 0.015 |
| 27.12.2019 | 0.019 | 0.022 | 0.018 |
| 26.12.2019 | 0.026 | 0.038 | 0.022 |
| 25.12.2019 | 0.025 | 0.044 | 0.015 |
© Bayerisches Landesamt für Umwelt 2024