
- Start >
- Rivers >
- Discharge >
- Untere Donau >
- Grafentraubach >
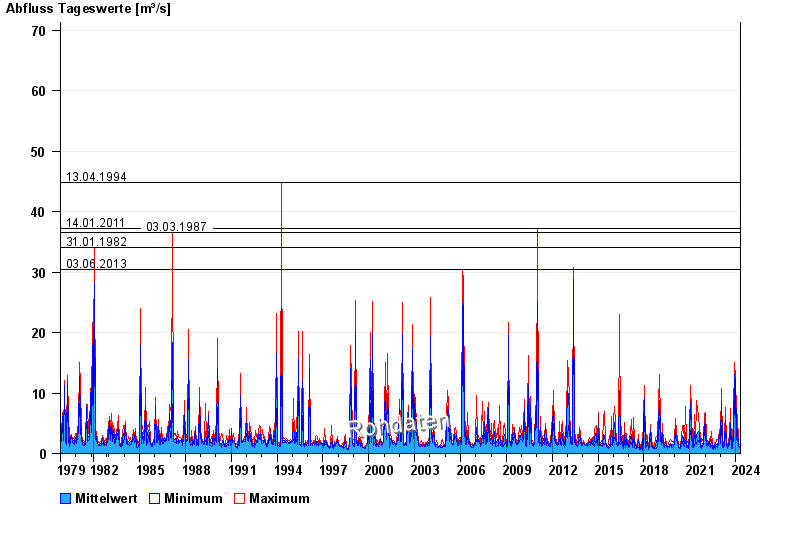
- Chart of total period

Chart of total period Grafentraubach / Kleine Laber
Discharge from 01.11.1979 to 26.04.2024
Pegel
Nahegelegene Bauarbeiten können zu Beeinflussungen des Wasserstands führen.
- 13.04.1994 Abfluss: 44,8 m³/s
- 14.01.2011 Abfluss: 37,2 m³/s
- 03.03.1987 Abfluss: 36,5 m³/s
- 31.01.1982 Abfluss: 34 m³/s
- 03.06.2013 Abfluss: 30,4 m³/s
| Date | Mean value [m³/s] | Maximum [m³/s] | Minimum [m³/s] |
|---|---|---|---|
| 26.04.2024 | 0.83 | 0.914 | 0.776 |
| 25.04.2024 | 0.809 | 0.914 | 0.776 |
| 24.04.2024 | 0.787 | 0.822 | 0.776 |
| 23.04.2024 | 0.879 | 0.914 | 0.822 |
| 22.04.2024 | 0.968 | 1.06 | 0.914 |
| 21.04.2024 | 1.03 | 1.18 | 0.959 |
| 20.04.2024 | 1.01 | 1.18 | 0.865 |
© Bayerisches Landesamt für Umwelt 2024