
- Start >
- Rivers >
- Discharge >
- Untere Donau >
- Grafenmühle >
- Chart of year

Chart of year Grafenmühle / Vils
Discharge from 25.08.2019 to 24.08.2020
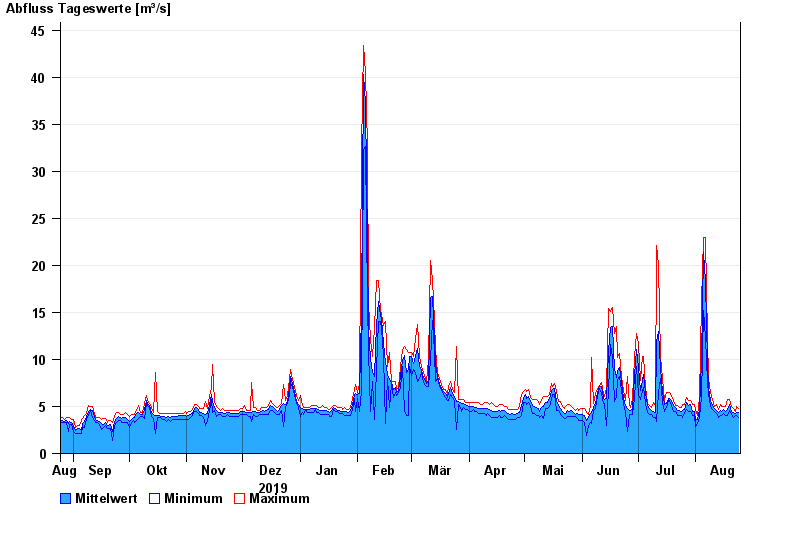
| Date | Mean value [m³/s] | Maximum [m³/s] | Minimum [m³/s] |
|---|---|---|---|
| 24.08.2020 | 4.38 | 4.74 | 3.86 |
| 23.08.2020 | 4.41 | 4.98 | 4.07 |
| 22.08.2020 | 4.3 | 4.51 | 4.07 |
| 21.08.2020 | 4.39 | 4.74 | 3.86 |
| 20.08.2020 | 4.51 | 5.03 | 4.15 |
| 19.08.2020 | 5.22 | 5.71 | 4.58 |
| 18.08.2020 | 4.68 | 5.72 | 4.06 |
© Bayerisches Landesamt für Umwelt 2024