
- Start >
- Rivers >
- Discharge >
- Untere Donau >
- Grafenmühle >
- Chart of year

Chart of year Grafenmühle / Vils
Discharge from 03.08.2021 to 02.08.2022
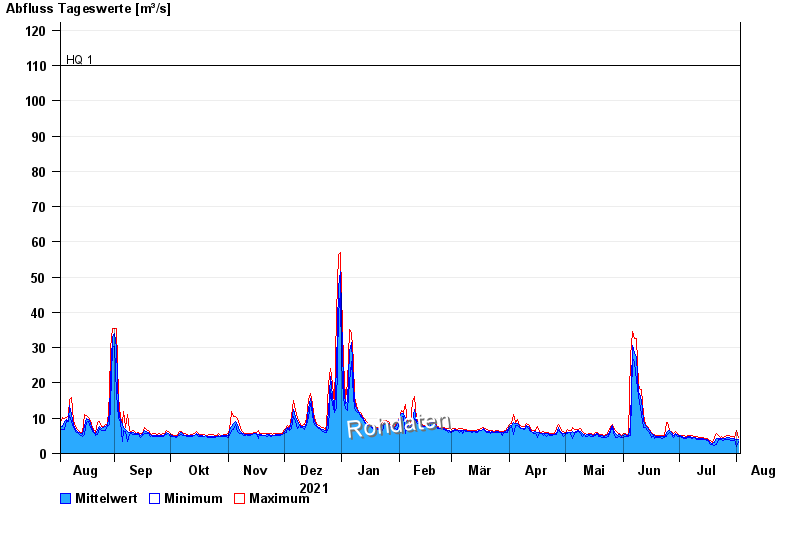
- HQ1 110 m³/s
- HQ2 148 m³/s
- HQ5 175 m³/s
- HQ10 205 m³/s
- HQ20 240 m³/s
| Date | Mean value [m³/s] | Maximum [m³/s] | Minimum [m³/s] |
|---|---|---|---|
| 02.08.2022 | 4.05 | 4.51 | 3.46 |
| 01.08.2022 | 3.97 | 6.54 | 1.99 |
| 31.07.2022 | 4.15 | 4.51 | 3.86 |
| 30.07.2022 | 4.17 | 4.74 | 3.66 |
| 29.07.2022 | 4.24 | 4.74 | 3.66 |
| 28.07.2022 | 4.4 | 4.98 | 3.86 |
| 27.07.2022 | 4.48 | 4.98 | 3.86 |
© Bayerisches Landesamt für Umwelt 2024