
- Start >
- Rivers >
- Discharge >
- Untere Donau >
- Grafenmühle >
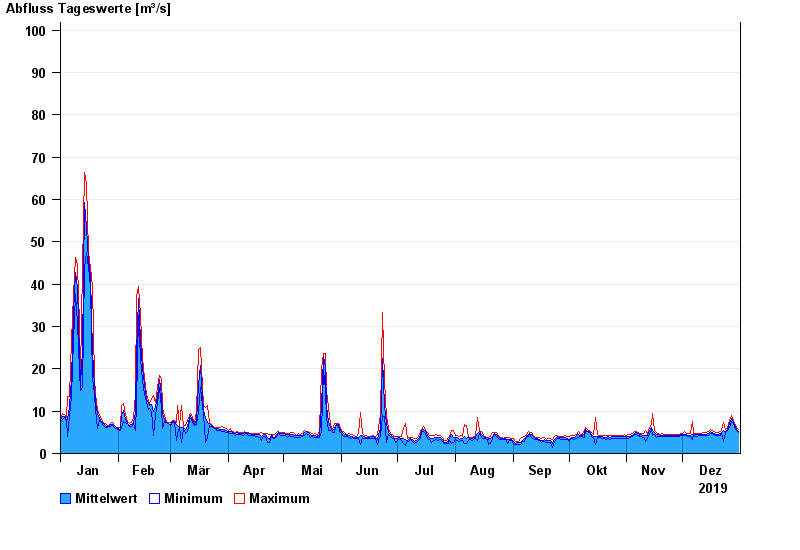
- Chart of year

Chart of year Grafenmühle / Vils
Discharge from 01.01.2019 to 31.12.2019
- 09.07.1954 Abfluss: 520 m³/s
- 04.03.1956 Abfluss: 298 m³/s
- 23.02.1970 Abfluss: 296 m³/s
- 14.01.2011 Abfluss: 291 m³/s
- 03.06.2013 Abfluss: 259 m³/s
| Date | Mean value [m³/s] | Maximum [m³/s] | Minimum [m³/s] |
|---|---|---|---|
| 31.12.2019 | 5.24 | 5.61 | 4.86 |
| 30.12.2019 | 5.58 | 6.14 | 5.35 |
| 29.12.2019 | 6.61 | 6.99 | 6.14 |
| 28.12.2019 | 7.33 | 7.91 | 6.99 |
| 27.12.2019 | 8.2 | 8.88 | 7.6 |
| 26.12.2019 | 7.03 | 7.91 | 6.14 |
| 25.12.2019 | 5.58 | 6.14 | 5.34 |
© Bayerisches Landesamt für Umwelt 2024