
- Start >
- Rivers >
- Discharge >
- Untere Donau >
- Grafenmühle >
- Chart of year

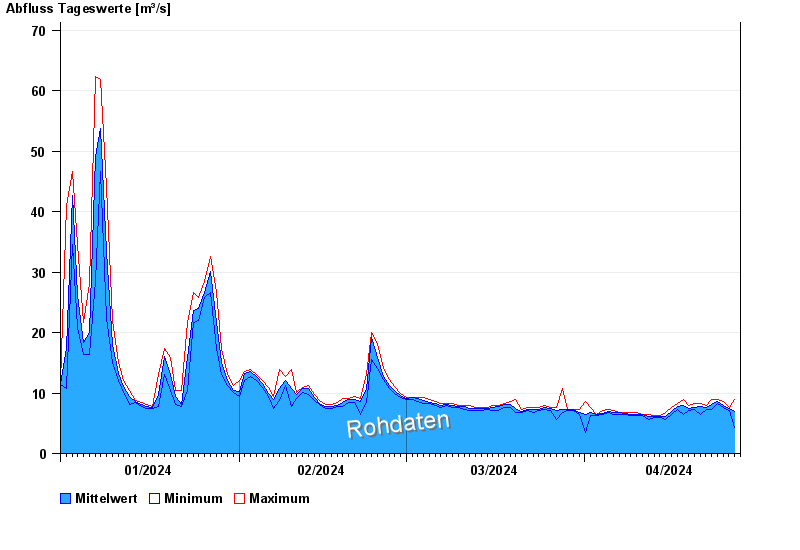
Chart of year Grafenmühle / Vils
Discharge from 01.01.2024 to 27.04.2024
| Date | Mean value [m³/s] | Maximum [m³/s] | Minimum [m³/s] |
|---|---|---|---|
| 27.04.2024 | 7.18 | 7.35 | 7.08 |
| 26.04.2024 | 7.44 | 7.66 | 7.08 |
| 25.04.2024 | 8.01 | 8.59 | 7.66 |
| 24.04.2024 | 8.63 | 8.93 | 8.32 |
| 23.04.2024 | 8.03 | 8.93 | 7.35 |
| 22.04.2024 | 7.6 | 7.99 | 7.35 |
| 21.04.2024 | 7.73 | 8.32 | 6.48 |
© Bayerisches Landesamt für Umwelt 2024