
- Start >
- Rivers >
- Discharge >
- Untere Donau >
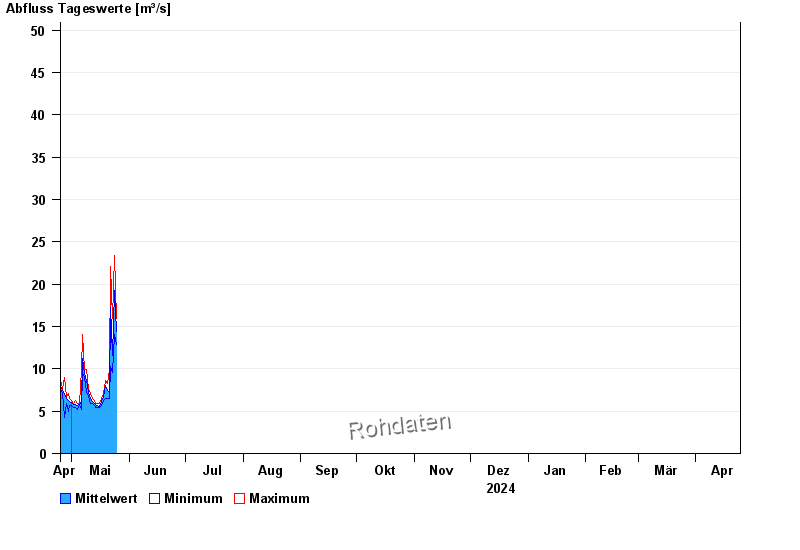
- Grafenmühle >
- Chart of year

Chart of year Grafenmühle / Vils
Discharge from 25.04.2024 to 24.04.2025
- HQ1 110 m³/s
- HQ2 148 m³/s
- HQ5 175 m³/s
- HQ10 205 m³/s
- HQ20 240 m³/s
| Date | Mean value [m³/s] | Maximum [m³/s] | Minimum [m³/s] |
|---|---|---|---|
| 06.05.2024 | 5.77 | 5.94 | 5.68 |
| 05.05.2024 | 5.87 | 6.21 | 5.68 |
| 04.05.2024 | 5.69 | 5.94 | 5.17 |
| 03.05.2024 | 5.83 | 6.21 | 5.42 |
| 02.05.2024 | 5.84 | 5.94 | 5.42 |
| 01.05.2024 | 5.98 | 6.21 | 5.68 |
| 30.04.2024 | 6.19 | 6.48 | 5.68 |
© Bayerisches Landesamt für Umwelt 2024