
- Start >
- Rivers >
- Discharge >
- Untere Donau >
- Grafenmühle >
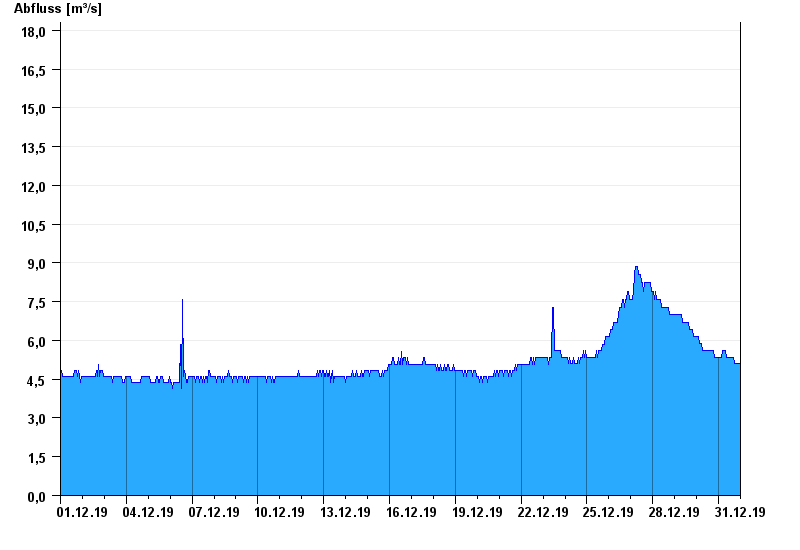
- Chart of month

Chart of month Grafenmühle / Vils
Discharge from 01.12.2019 to 31.12.2019
- HQ1 110 m³/s
- HQ2 148 m³/s
- HQ5 175 m³/s
- HQ10 205 m³/s
- HQ20 240 m³/s
| Date | Runoff [m³/s] |
|---|---|
| 31.12.2019 23:45 | 5.1 |
| 31.12.2019 23:30 | 4.86 |
| 31.12.2019 23:15 | 4.86 |
| 31.12.2019 23:00 | 5.1 |
| 31.12.2019 22:45 | 5.1 |
| 31.12.2019 22:30 | 4.86 |
| 31.12.2019 22:15 | 4.86 |
© Bayerisches Landesamt für Umwelt 2024