
- Start >
- Rivers >
- Discharge >
- Untere Donau >
- Grafenau >
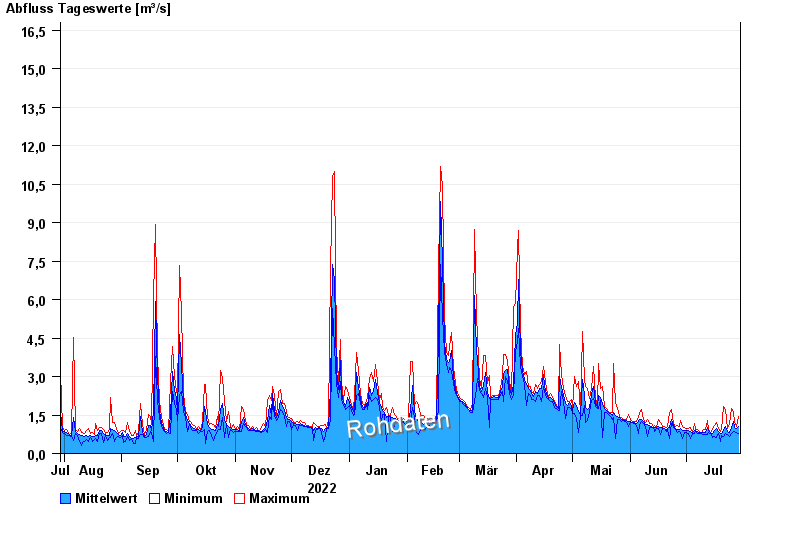
- Chart of year

Chart of year Grafenau / Kleine Ohe
Discharge from 30.07.2022 to 29.07.2023
- 12.08.2002 Abfluss: 71,2 m³/s
- 13.08.2002 Abfluss: 66,3 m³/s
- 21.12.1993 Abfluss: 51,4 m³/s
- 21.03.2002 Abfluss: 47,3 m³/s
- 09.08.2002 Abfluss: 37,2 m³/s
| Date | Mean value [m³/s] | Maximum [m³/s] | Minimum [m³/s] |
|---|---|---|---|
| 29.07.2023 | 1.04 | 1.46 | 0.798 |
| 28.07.2023 | 0.957 | 1.05 | 0.837 |
| 27.07.2023 | 1.03 | 1.2 | 0.876 |
| 26.07.2023 | 1.26 | 1.58 | 0.876 |
| 25.07.2023 | 1 | 1.77 | 0.798 |
| 24.07.2023 | 0.835 | 1.15 | 0.677 |
| 23.07.2023 | 0.865 | 0.969 | 0.755 |
© Bayerisches Landesamt für Umwelt 2024