
- Start >
- Rivers >
- Discharge >
- Untere Donau >
- Grafenau >
- Chart of year

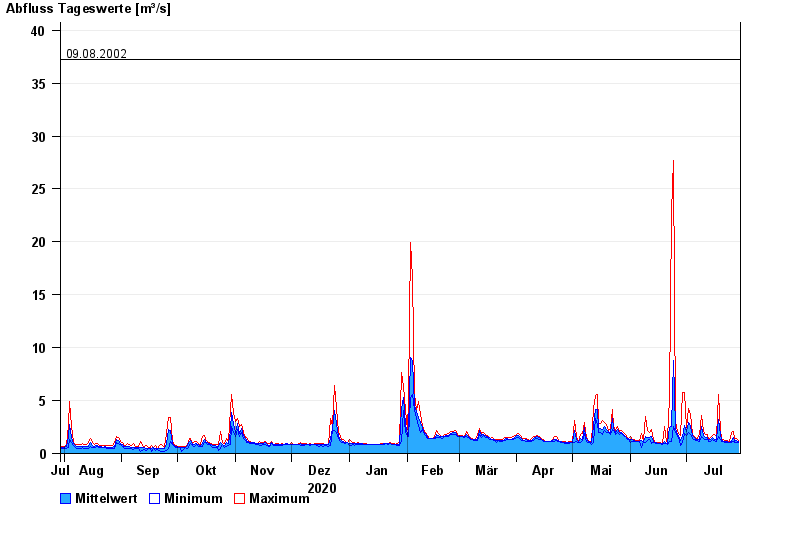
Chart of year Grafenau / Kleine Ohe
Discharge from 30.07.2020 to 29.07.2021
- 12.08.2002 Abfluss: 71,2 m³/s
- 13.08.2002 Abfluss: 66,3 m³/s
- 21.12.1993 Abfluss: 51,4 m³/s
- 21.03.2002 Abfluss: 47,3 m³/s
- 09.08.2002 Abfluss: 37,2 m³/s
| Date | Mean value [m³/s] | Maximum [m³/s] | Minimum [m³/s] |
|---|---|---|---|
| 29.07.2021 | 1.16 | 1.26 | 1.07 |
| 28.07.2021 | 1.21 | 1.43 | 1.03 |
| 27.07.2021 | 1.16 | 1.31 | 1.03 |
| 26.07.2021 | 1.5 | 2.09 | 1.11 |
| 25.07.2021 | 1.11 | 2.02 | 1.06 |
| 24.07.2021 | 1.07 | 1.15 | 1.02 |
| 23.07.2021 | 1.1 | 1.2 | 1.02 |
© Bayerisches Landesamt für Umwelt 2024