
- Start >
- Rivers >
- Discharge >
- Untere Donau >
- Grafenau >
- Chart of year

Chart of year Grafenau / Kleine Ohe
Discharge from 30.03.2024 to 29.03.2025
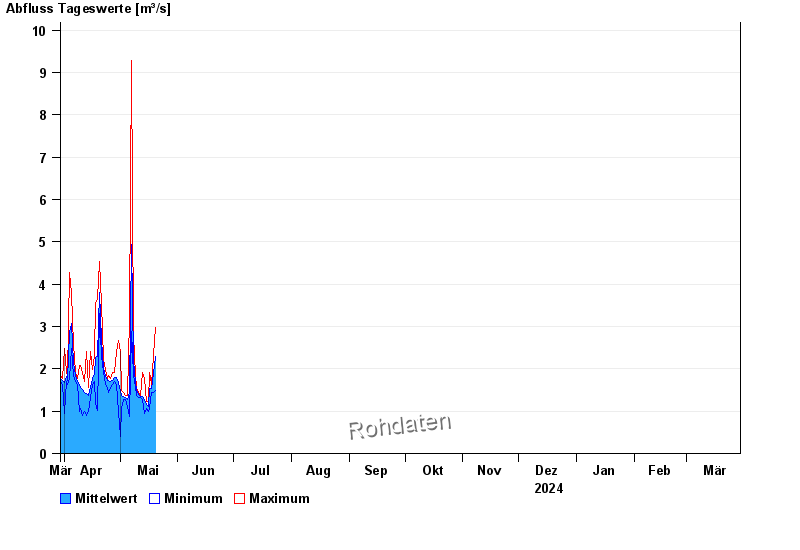
| Date | Mean value [m³/s] | Maximum [m³/s] | Minimum [m³/s] |
|---|---|---|---|
| 31.05.2024 | 1.84 | 1.84 | 1.84 |
| 30.05.2024 | 1.77 | 2.07 | 1.5 |
| 29.05.2024 | 1.7 | 1.84 | 1.57 |
| 28.05.2024 | 1.89 | 2.14 | 1.57 |
| 27.05.2024 | 1.63 | 1.7 | 1.57 |
| 26.05.2024 | 1.76 | 2.07 | 1.27 |
| 25.05.2024 | 2.01 | 2.98 | 0.726 |
© Bayerisches Landesamt für Umwelt 2024