
- Start >
- Rivers >
- Discharge >
- Untere Donau >
- Grafenau >
- Chart of year

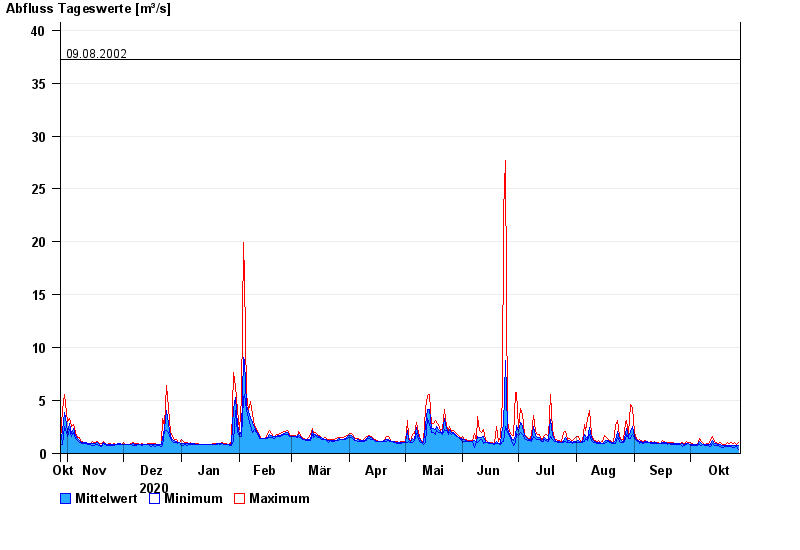
Chart of year Grafenau / Kleine Ohe
Discharge from 28.10.2020 to 27.10.2021
- 12.08.2002 Abfluss: 71,2 m³/s
- 13.08.2002 Abfluss: 66,3 m³/s
- 21.12.1993 Abfluss: 51,4 m³/s
- 21.03.2002 Abfluss: 47,3 m³/s
- 09.08.2002 Abfluss: 37,2 m³/s
| Date | Mean value [m³/s] | Maximum [m³/s] | Minimum [m³/s] |
|---|---|---|---|
| 27.10.2021 | 0.753 | 1.07 | 0.412 |
| 26.10.2021 | 0.739 | 0.873 | 0.622 |
| 25.10.2021 | 0.764 | 1.04 | 0.56 |
| 24.10.2021 | 0.743 | 0.917 | 0.593 |
| 23.10.2021 | 0.801 | 1 | 0.664 |
| 22.10.2021 | 0.799 | 0.923 | 0.7 |
| 21.10.2021 | 0.78 | 1.05 | 0.704 |
© Bayerisches Landesamt für Umwelt 2024