
- Start >
- Rivers >
- Discharge >
- Untere Donau >
- Grafenau >
- Chart of year

Chart of year Grafenau / Kleine Ohe
Discharge from 28.09.2023 to 27.09.2024
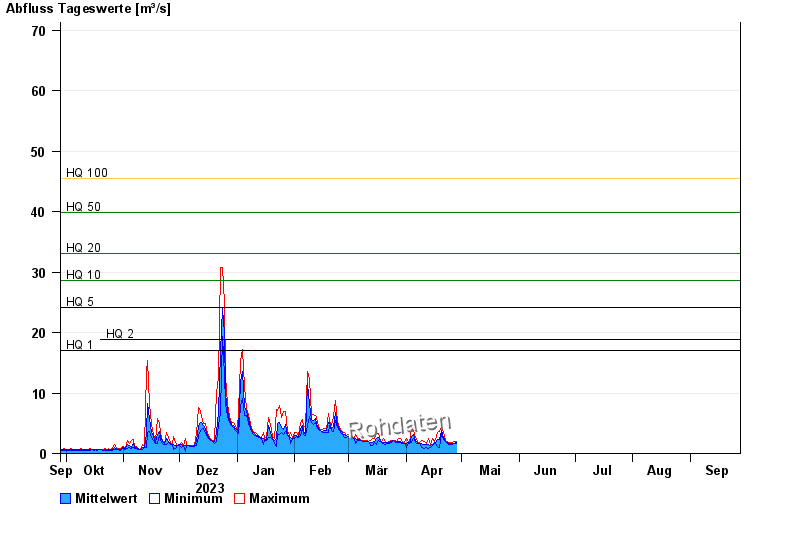
- HQ1 17 m³/s
- HQ2 18,9 m³/s
- HQ5 24,2 m³/s
- HQ10 28,6 m³/s
- HQ20 33,1 m³/s
- HQ50 39,9 m³/s
- HQ100 45,4 m³/s
| Date | Mean value [m³/s] | Maximum [m³/s] | Minimum [m³/s] |
|---|---|---|---|
| 14.05.2024 | 1.27 | 1.32 | 0.942 |
| 13.05.2024 | 1.35 | 1.91 | 1.27 |
| 12.05.2024 | 1.34 | 1.38 | 1.32 |
| 11.05.2024 | 1.4 | 1.44 | 1.32 |
| 10.05.2024 | 1.49 | 1.57 | 1.38 |
| 09.05.2024 | 1.68 | 1.84 | 1.57 |
| 08.05.2024 | 2.19 | 2.78 | 1.84 |
© Bayerisches Landesamt für Umwelt 2024