
- Start >
- Rivers >
- Discharge >
- Untere Donau >
- Grafenau >
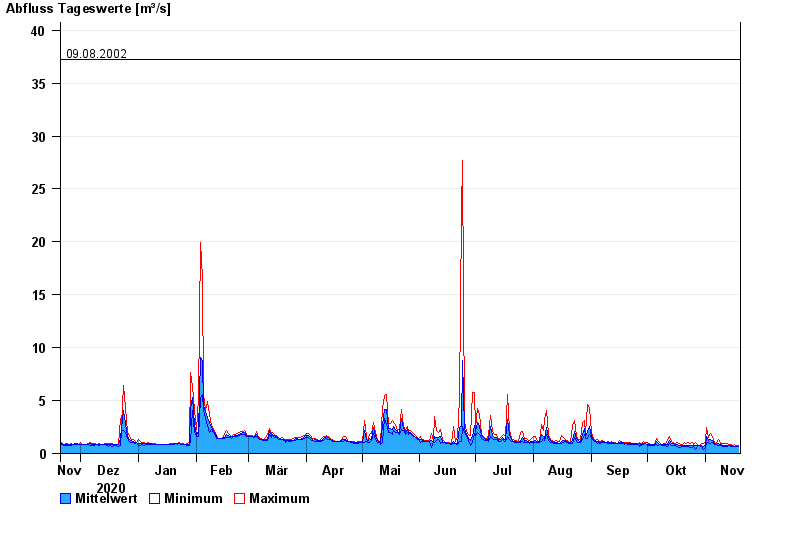
- Chart of year

Chart of year Grafenau / Kleine Ohe
Discharge from 20.11.2020 to 19.11.2021
- 12.08.2002 Abfluss: 71,2 m³/s
- 13.08.2002 Abfluss: 66,3 m³/s
- 21.12.1993 Abfluss: 51,4 m³/s
- 21.03.2002 Abfluss: 47,3 m³/s
- 09.08.2002 Abfluss: 37,2 m³/s
| Date | Mean value [m³/s] | Maximum [m³/s] | Minimum [m³/s] |
|---|---|---|---|
| 19.11.2021 | 0.696 | 0.722 | 0.658 |
| 18.11.2021 | 0.703 | 0.755 | 0.657 |
| 17.11.2021 | 0.685 | 0.821 | 0.625 |
| 16.11.2021 | 0.694 | 0.779 | 0.645 |
| 15.11.2021 | 0.761 | 0.852 | 0.646 |
| 14.11.2021 | 0.794 | 0.895 | 0.714 |
| 13.11.2021 | 0.764 | 0.934 | 0.651 |
© Bayerisches Landesamt für Umwelt 2024