
- Start >
- Rivers >
- Discharge >
- Untere Donau >
- Grafenau >
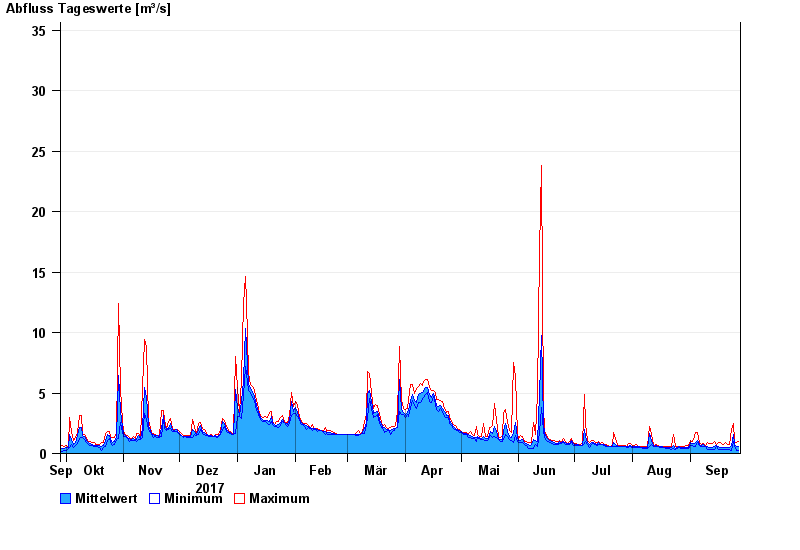
- Chart of year

Chart of year Grafenau / Kleine Ohe
Discharge from 28.09.2017 to 27.09.2018
- 12.08.2002 Abfluss: 71,2 m³/s
- 13.08.2002 Abfluss: 66,3 m³/s
- 21.12.1993 Abfluss: 51,4 m³/s
- 21.03.2002 Abfluss: 47,3 m³/s
- 09.08.2002 Abfluss: 37,2 m³/s
| Date | Mean value [m³/s] | Maximum [m³/s] | Minimum [m³/s] |
|---|---|---|---|
| 27.09.2018 | 0.563 | 0.974 | 0.254 |
| 26.09.2018 | 0.599 | 0.913 | 0.285 |
| 25.09.2018 | 0.758 | 0.983 | 0.571 |
| 24.09.2018 | 1.59 | 2.49 | 0.983 |
| 23.09.2018 | 0.678 | 1.97 | 0.289 |
| 22.09.2018 | 0.459 | 0.742 | 0.29 |
| 21.09.2018 | 0.457 | 0.743 | 0.291 |
© Bayerisches Landesamt für Umwelt 2024